Bita
A preventative dental health ecosystem connecting patients, dentists, and insurers
Source: squarespace-export/images/bita/001.JPG–032.jpeg (32 slides). SCAD student project (lanyards/classroom crit visible in process photos).
Suggested title & subtitle
Title: Bita Subtitle: A preventative dental health ecosystem that connects patients, dentists, and insurance providers through a smart brushing kit, a companion app, and shared habit-tracking — turning routine oral care into a collaborative, incentivized relationship between all three stakeholders.
Note on file order: the raw slide order doesn't read as a clean narrative (Gantt chart first, outcome metrics mid-deck, process-crit photos interrupting research-synthesis diagrams). This write-up is organized by topic, not raw file order — treat the file order as source material, not page sequence.
Process & Timeline (slide 001)
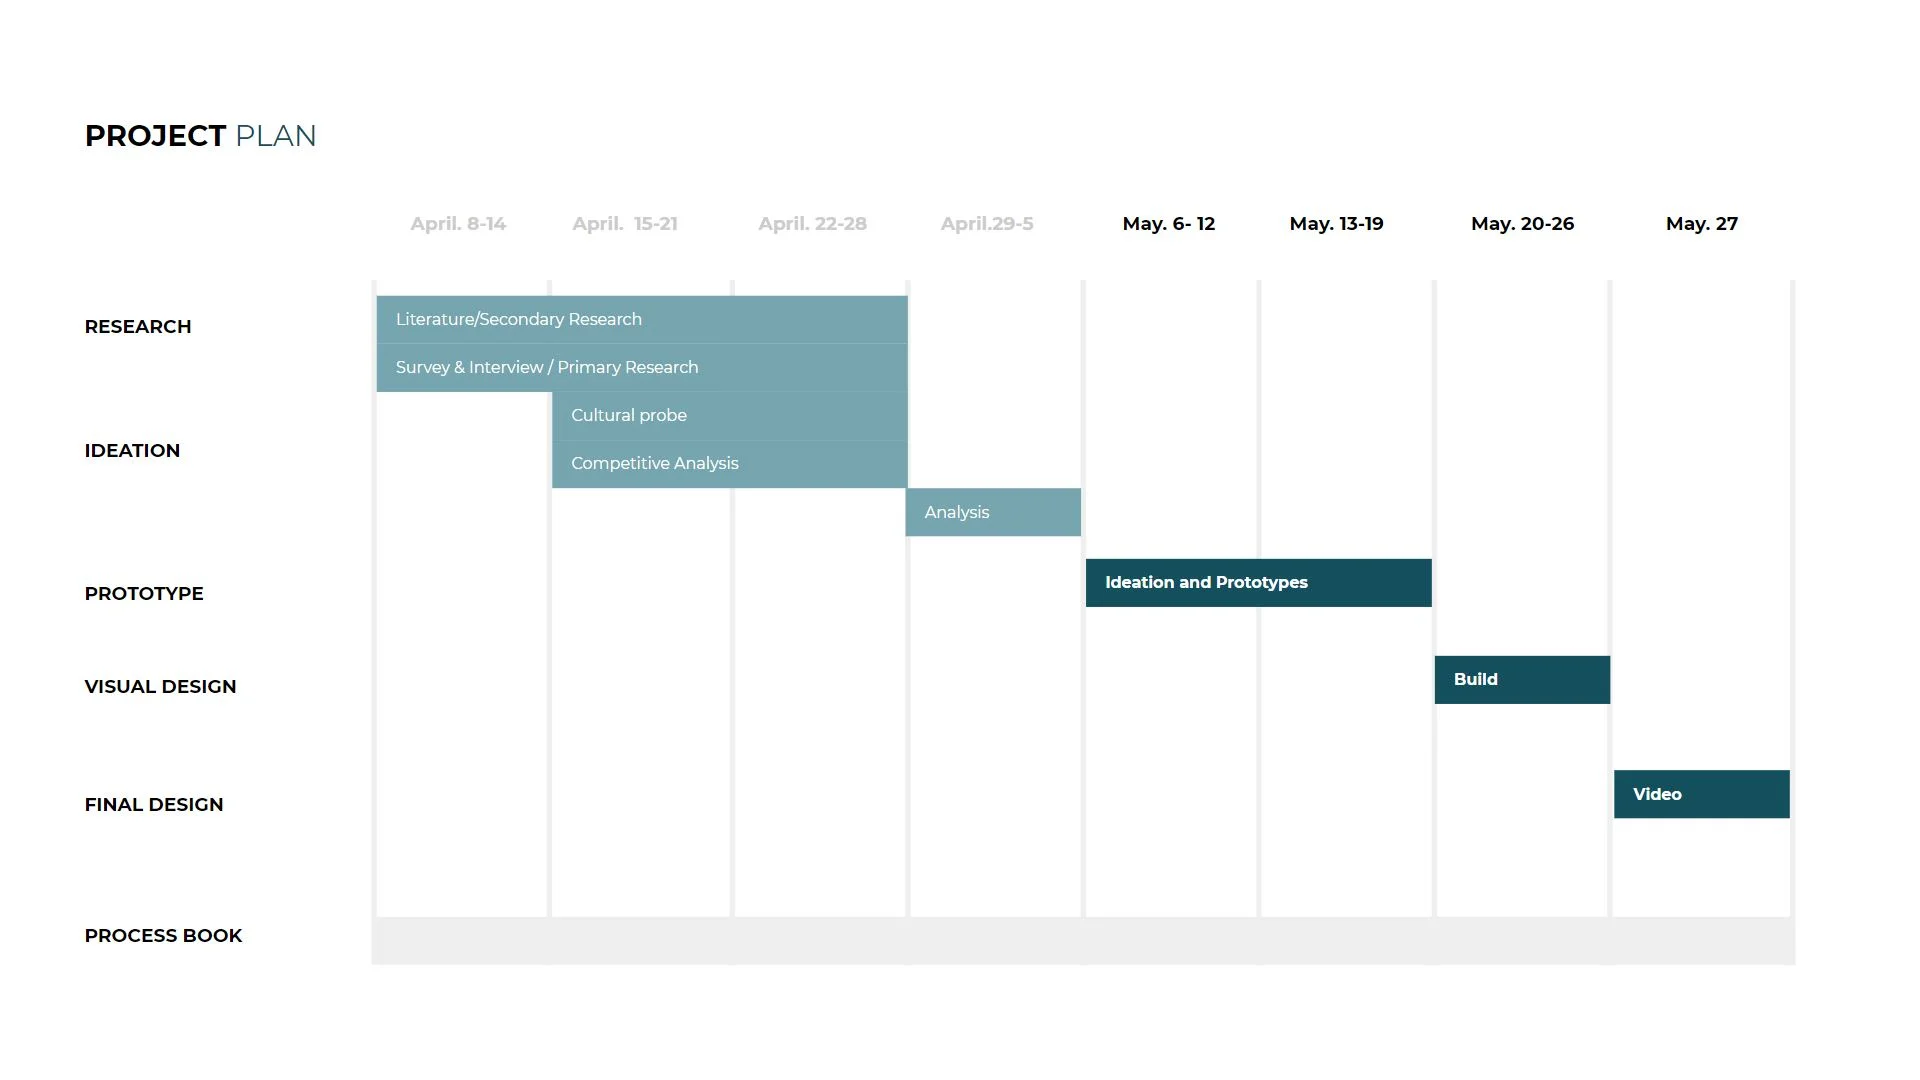 Project Plan Gantt chart, April 8 – May 27: Research (Literature/Secondary Research, Survey & Interview/Primary Research, Apr 8–28) → Ideation (Cultural probe, Competitive Analysis, Apr 15–28) → Analysis (Apr 29–May 5) → Prototype (Ideation and Prototypes, May 6–12) → Visual Design (Build, May 20–26) → Final Design (Video, May 27) → Process Book (continuous).
Research & Discovery
Patient Interviews — Key Findings (two rounds, slides 002 & 007)
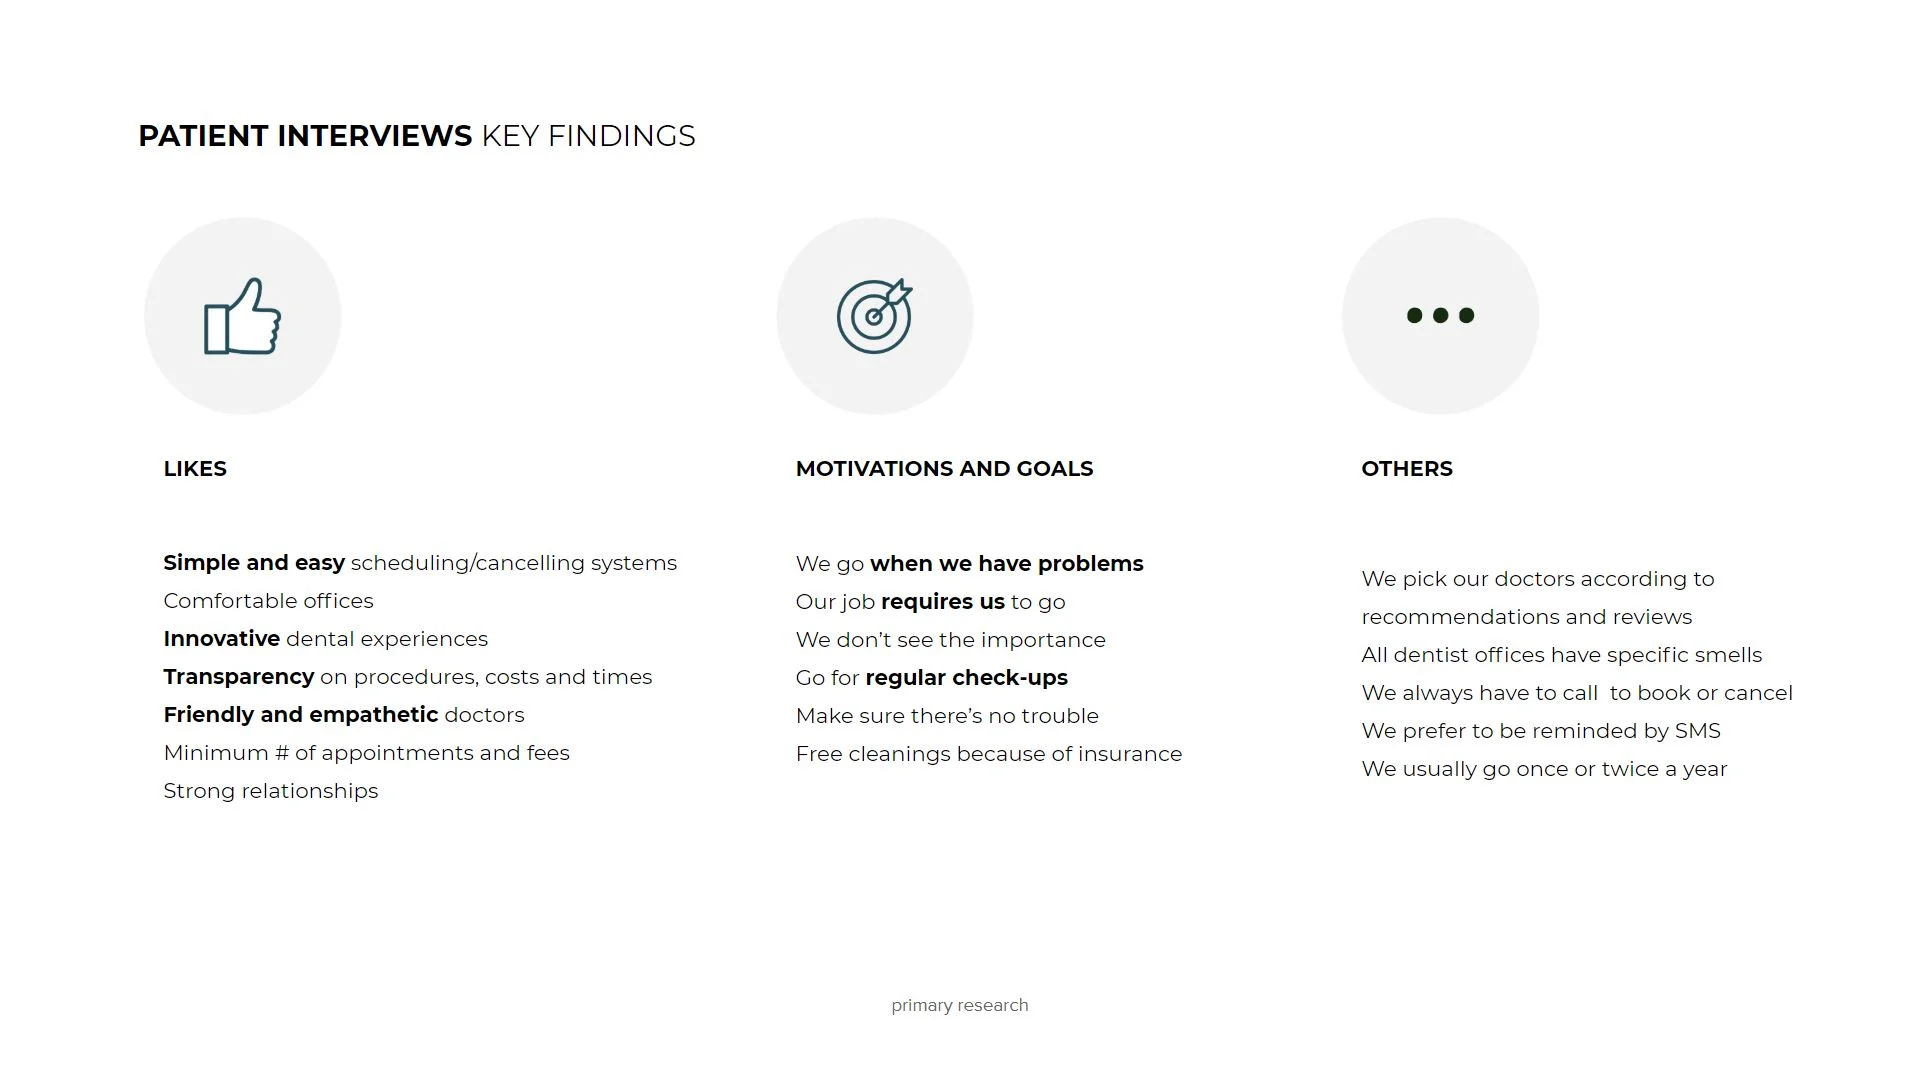
Round 1 — Likes: Simple/easy scheduling-cancelling systems; Comfortable offices; Innovative dental experiences; Transparency on procedures/costs/times; Friendly and empathetic doctors; Minimum appointments and fees; Strong relationships. Round 1 — Motivations/Goals: We go when we have problems; Our job requires us to go; We don't see the importance; Go for regular check-ups; Make sure there's no trouble; Free cleanings because of insurance. Round 1 — Others: We pick doctors by recommendations/reviews; All dentist offices have specific smells; We always have to call to book or cancel; We prefer SMS reminders; We usually go once or twice a year.
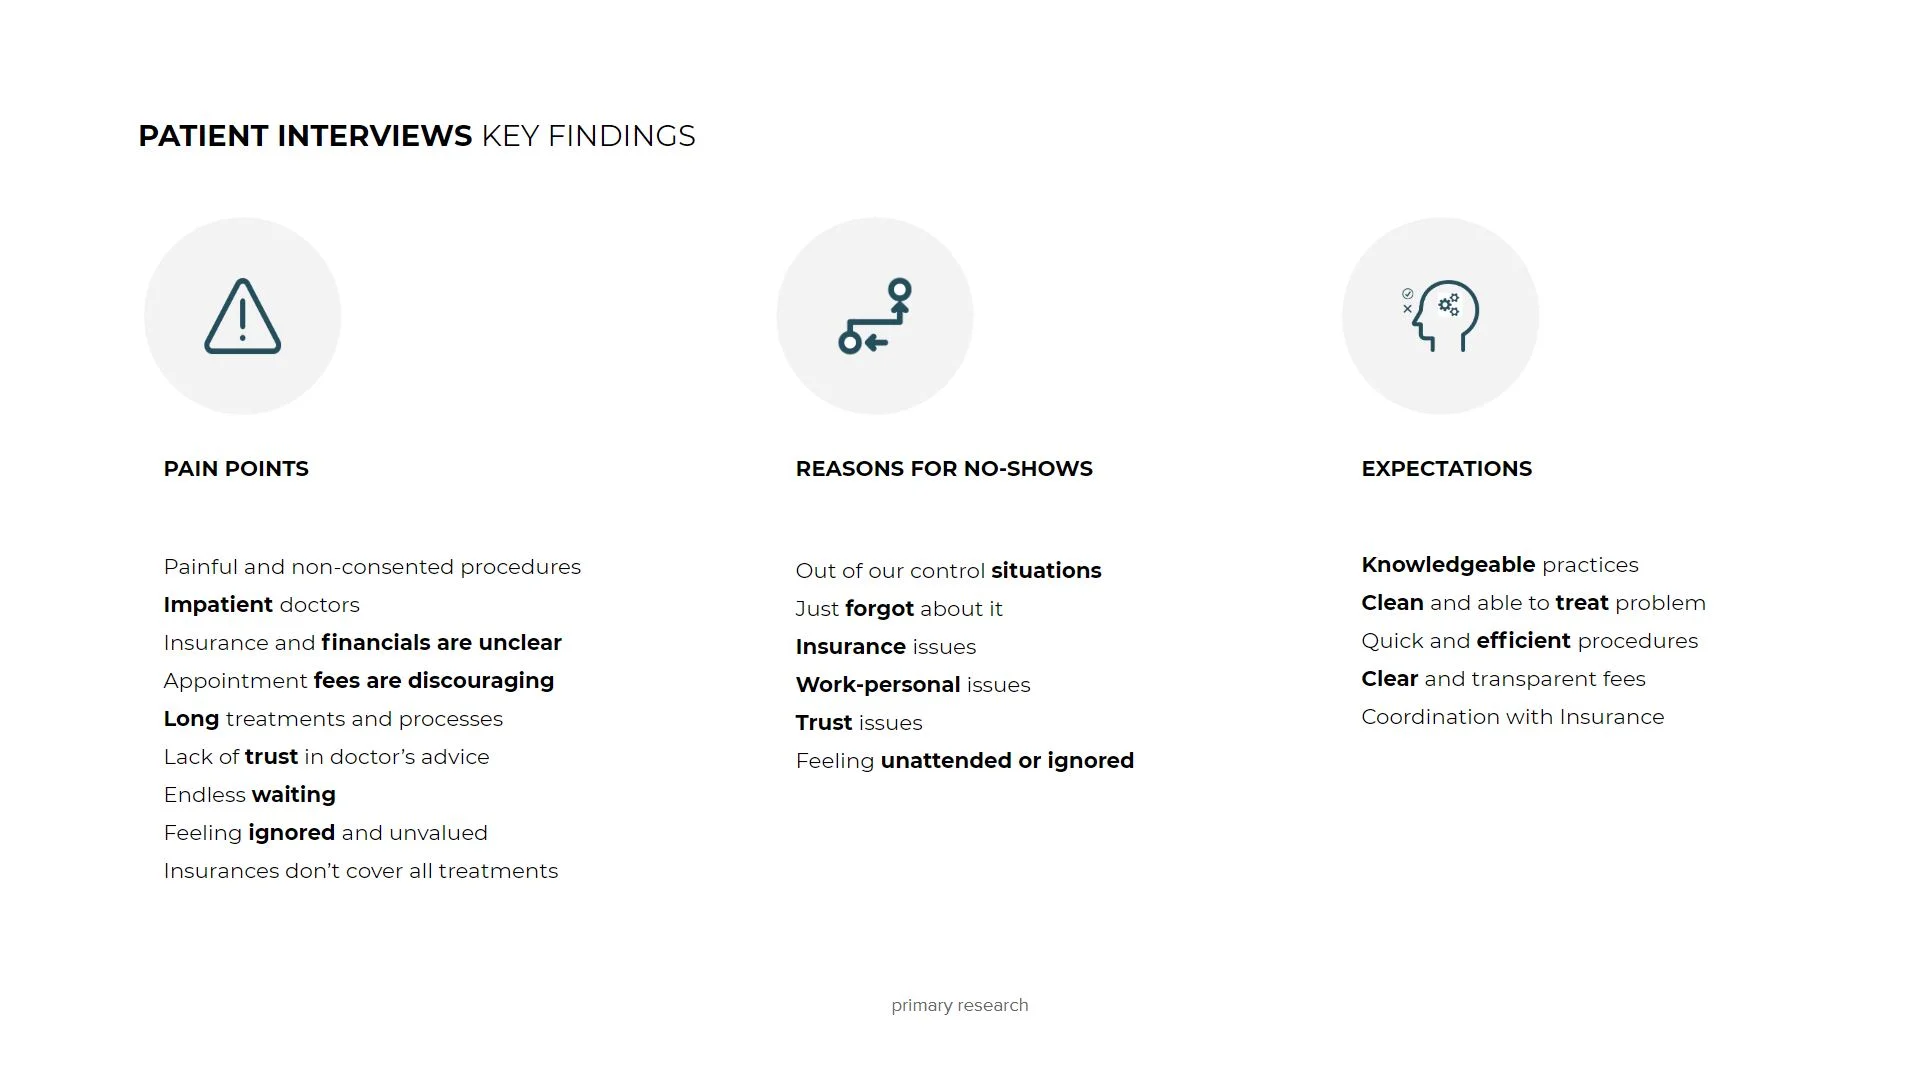
Round 2 — Pain Points: Painful and non-consented procedures; Impatient doctors; Insurance and financials are unclear; Appointment fees are discouraging; Long treatments and processes; Lack of trust in doctor's advice; Endless waiting; Feeling ignored and unvalued; Insurances don't cover all treatments. Round 2 — Reasons for No-Shows: Out of our control situations; Just forgot about it; Insurance issues; Work-personal issues; Trust issues; Feeling unattended or ignored. Round 2 — Expectations: Knowledgeable practices; Clean and able to treat problem; Quick and efficient procedures; Clear and transparent fees; Coordination with Insurance.
Doctor Interviews — Key Findings (slides 003 & 006)
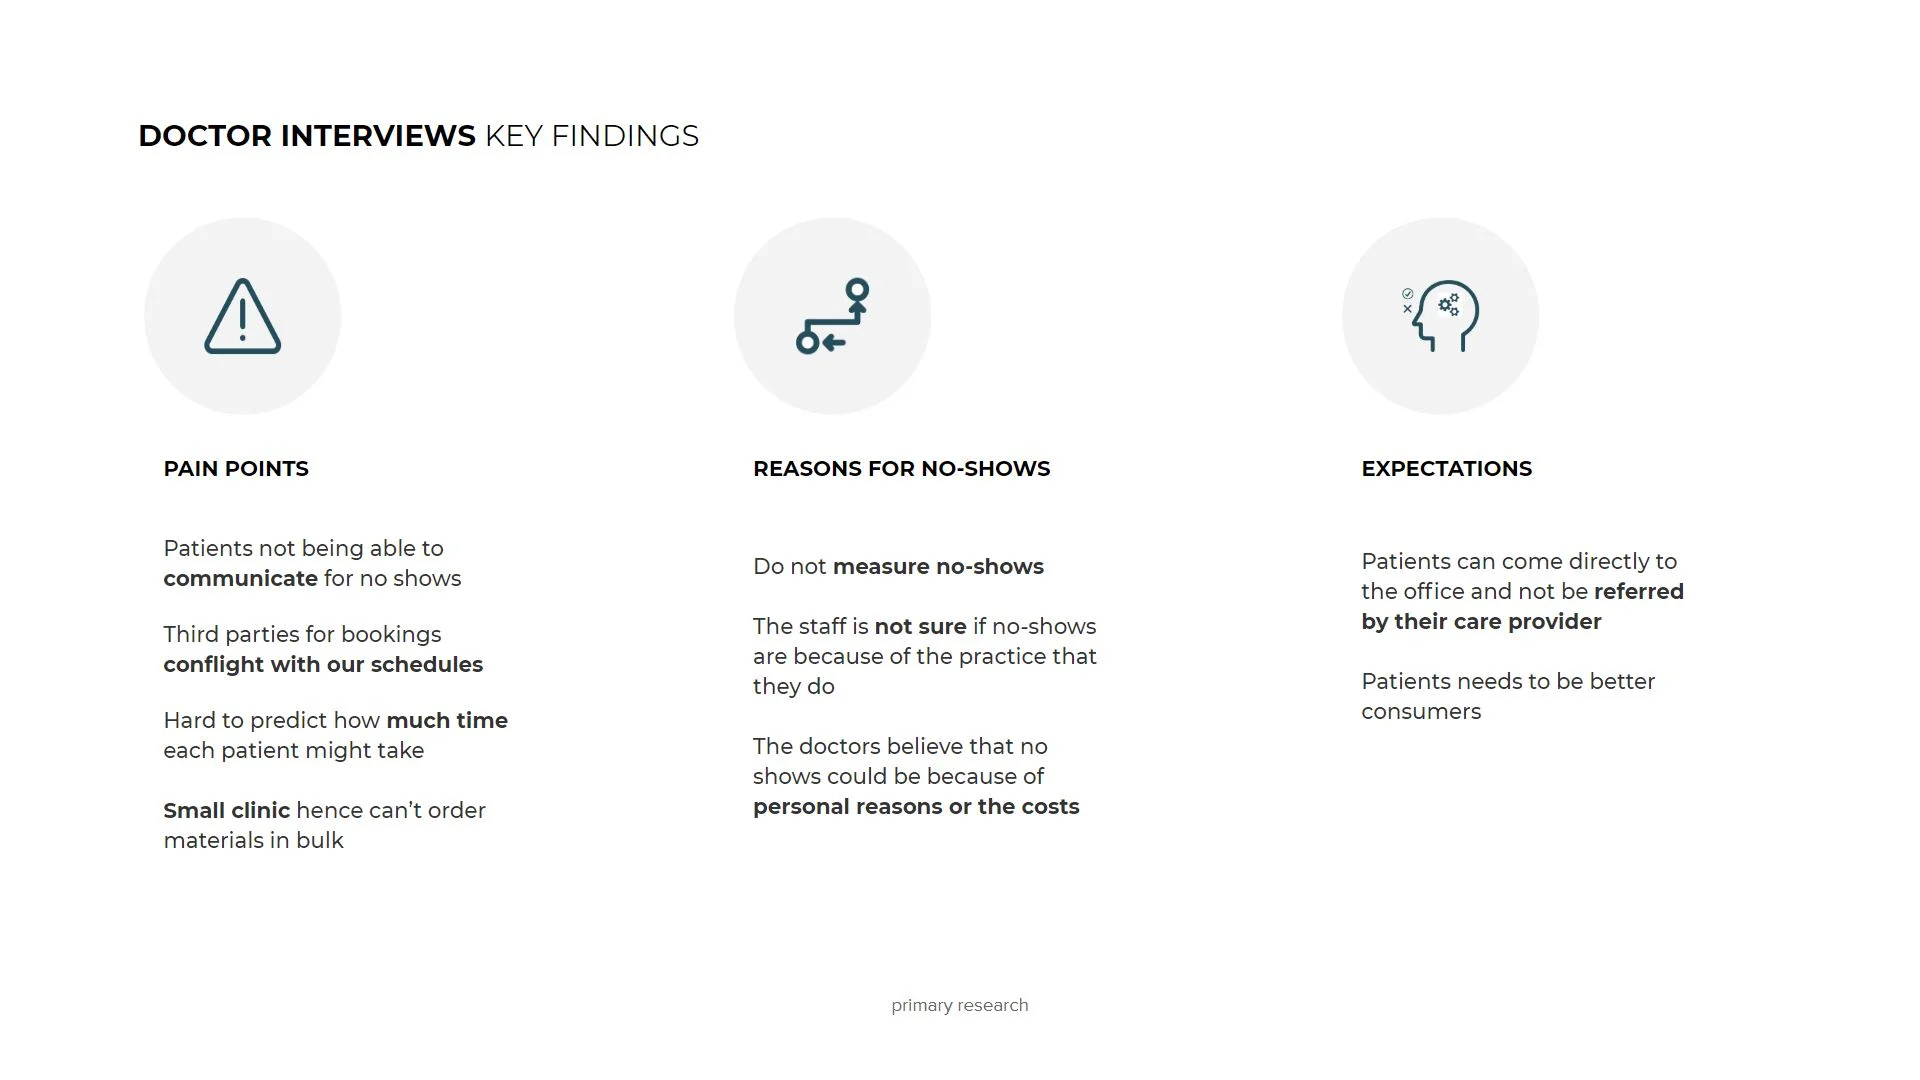
 Pain Points: Patients not being able to communicate for no shows; Third parties for bookings conflict with our schedules; Hard to predict how much time each patient might take; Small clinic hence can't order materials in bulk.
Reasons for No-Shows: Do not measure no-shows; Staff unsure if no-shows are because of their own practice; Doctors believe no-shows could be personal reasons or costs.
Expectations: Patients can come directly to the office without referral; Patients need to be better consumers.
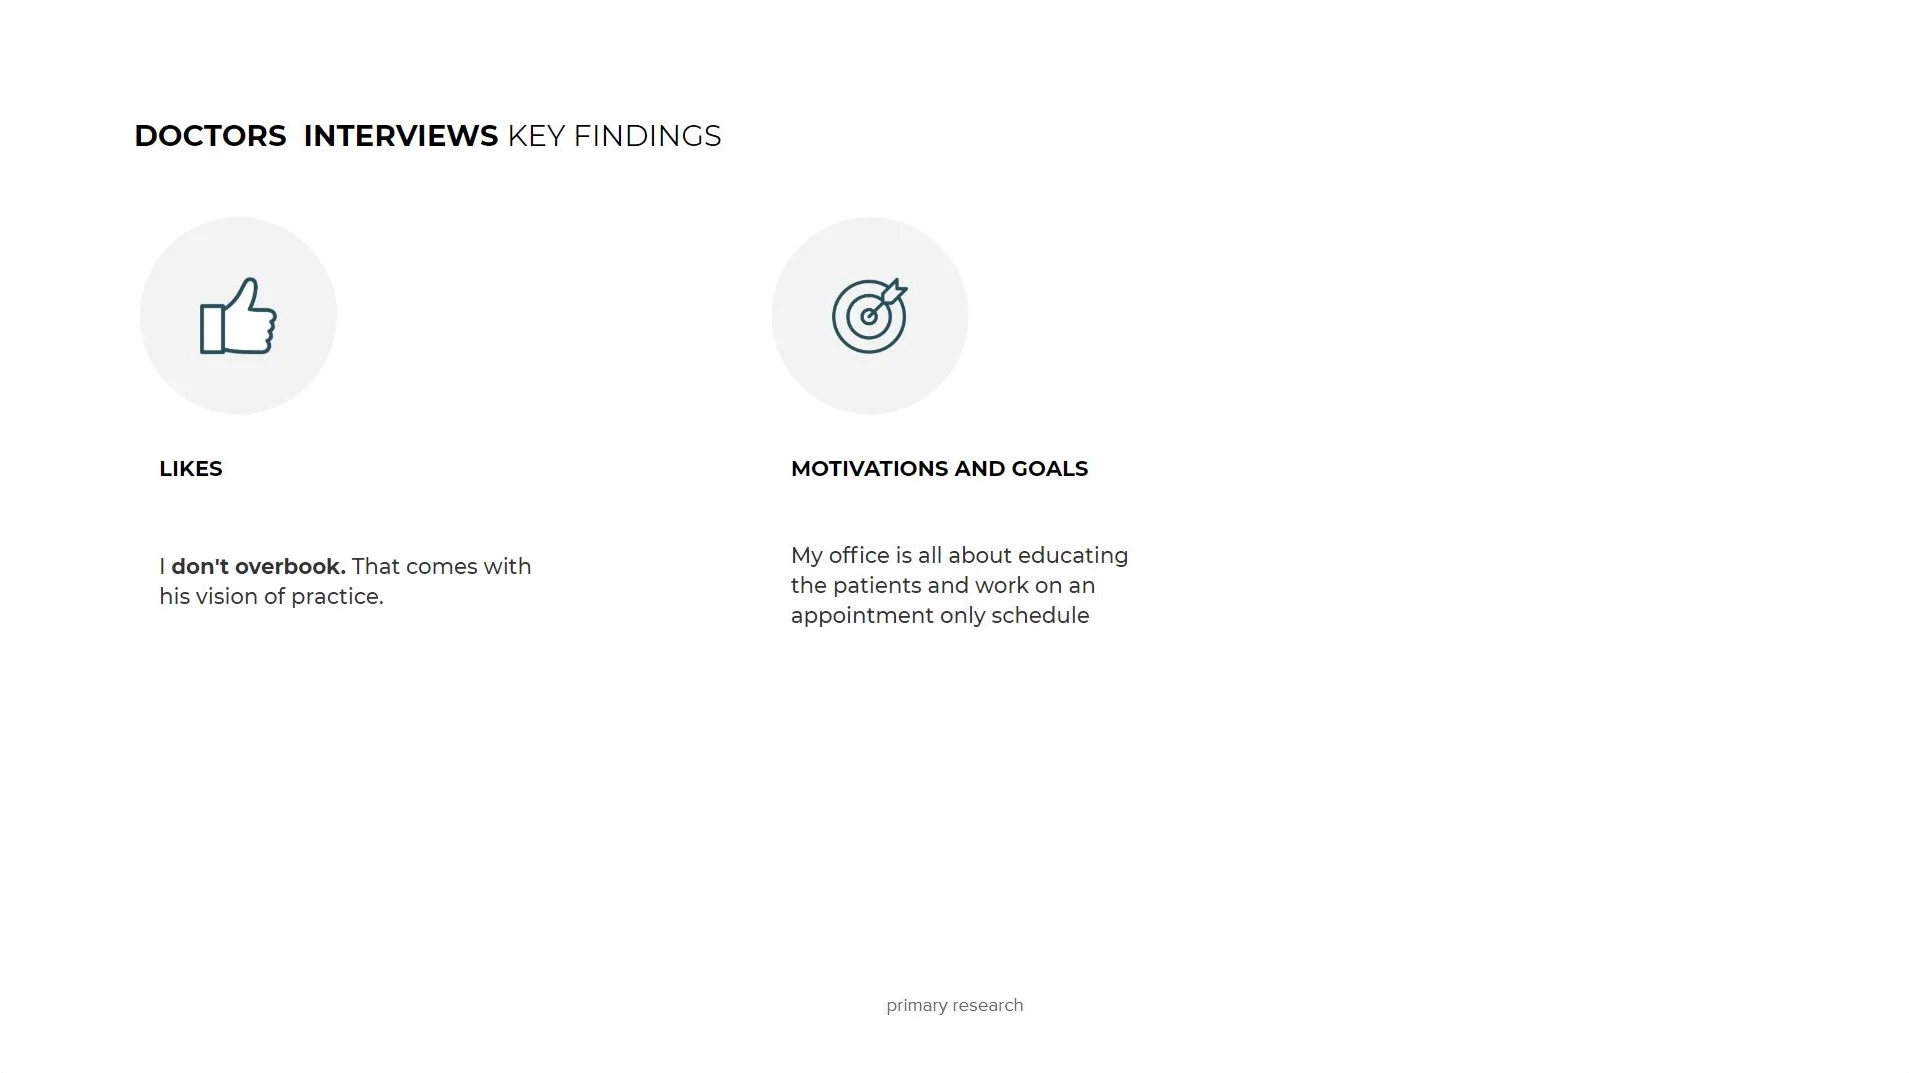
One interviewee quote: "I don't overbook. That comes with his vision of practice." / "My office is all about educating the patients and work on an appointment only schedule."
Pain Points: Patients not being able to communicate for no shows; Third parties for bookings conflict with our schedules; Hard to predict how much time each patient might take; Small clinic hence can't order materials in bulk.
Reasons for No-Shows: Do not measure no-shows; Staff unsure if no-shows are because of their own practice; Doctors believe no-shows could be personal reasons or costs.
Expectations: Patients can come directly to the office without referral; Patients need to be better consumers.
One interviewee quote: "I don't overbook. That comes with his vision of practice." / "My office is all about educating the patients and work on an appointment only schedule."
Survey Data (slide 004)
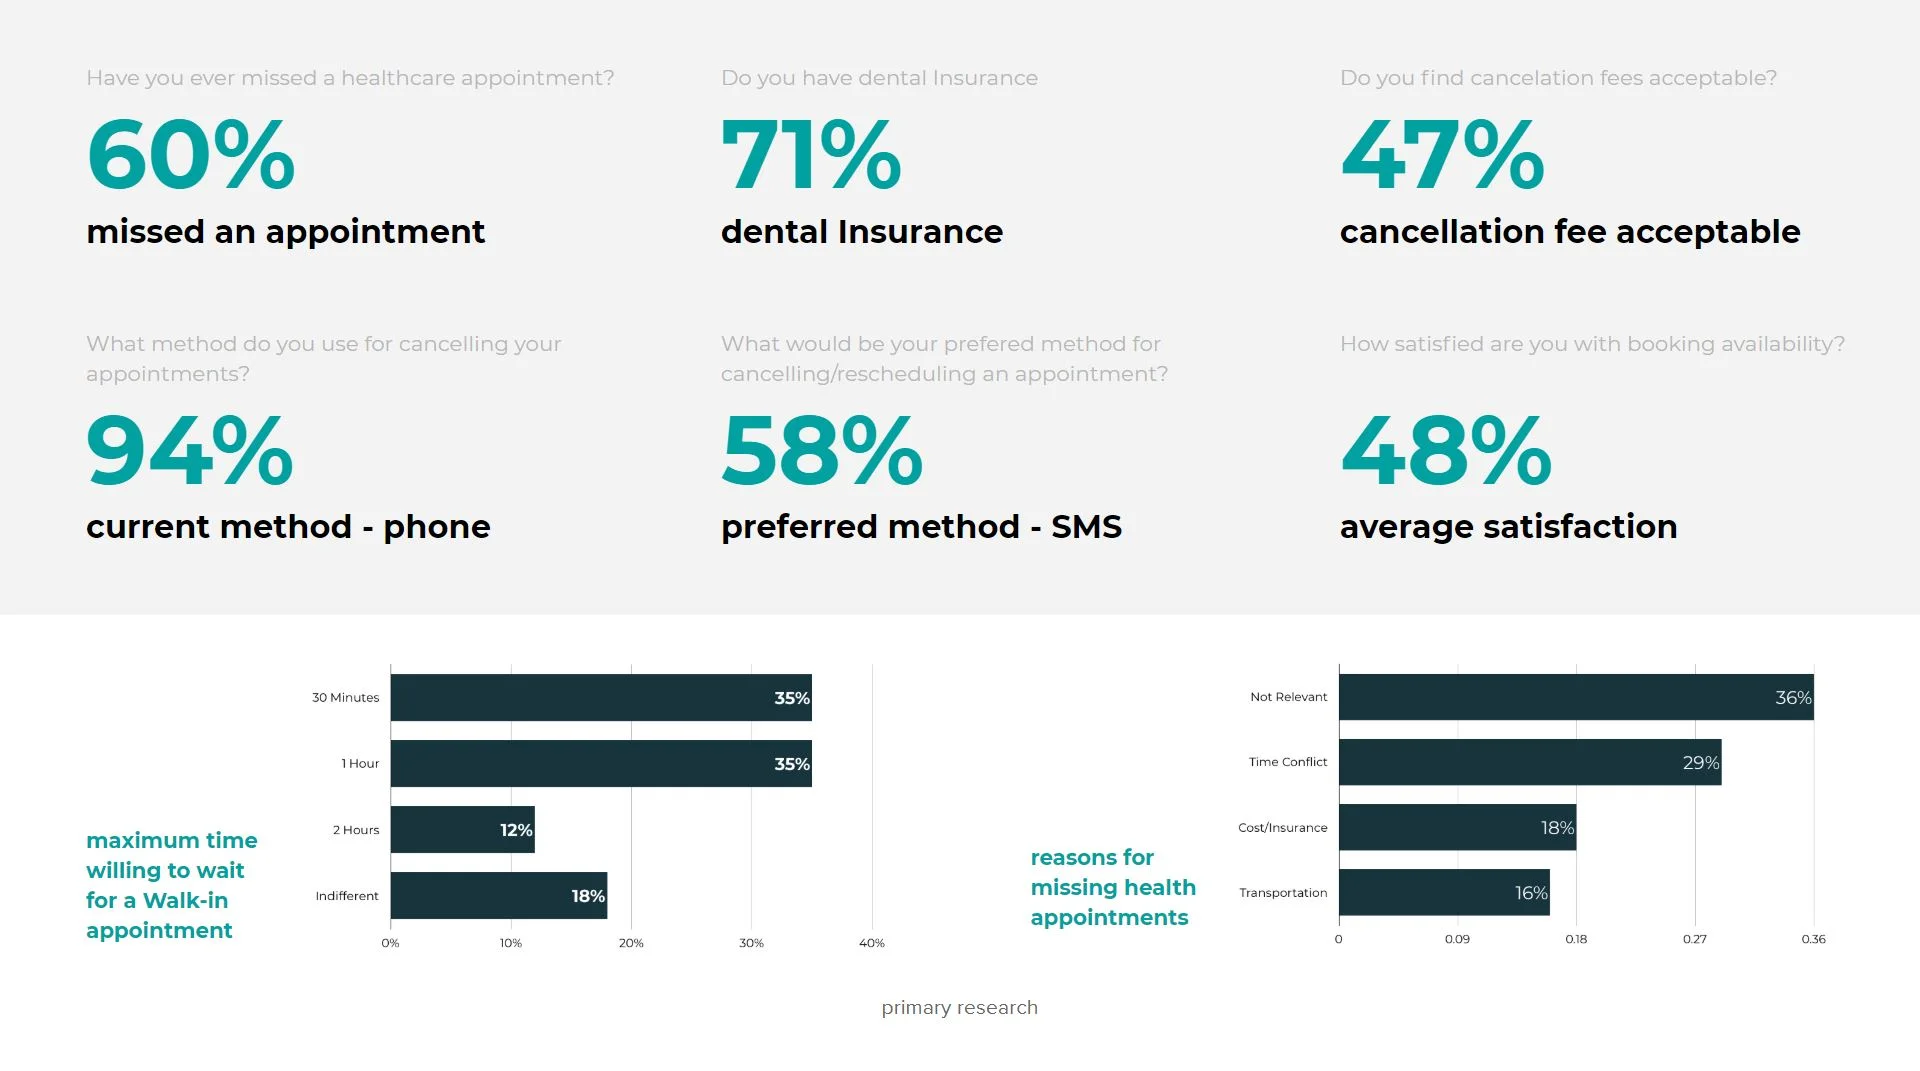 60% have missed an appointment; 71% have dental insurance; 47% find cancellation fees acceptable; 94% currently cancel by phone; 58% prefer SMS; 48% average satisfaction with booking availability.
Max wait time willing to tolerate for walk-in: 30 min 35%, 1 hour 35%, 2 hours 12%, Indifferent 18%.
Reasons for missing appointments: Not Relevant 36%, Time Conflict 29%, Cost/Insurance 18%, Transportation 16%.
60% have missed an appointment; 71% have dental insurance; 47% find cancellation fees acceptable; 94% currently cancel by phone; 58% prefer SMS; 48% average satisfaction with booking availability.
Max wait time willing to tolerate for walk-in: 30 min 35%, 1 hour 35%, 2 hours 12%, Indifferent 18%.
Reasons for missing appointments: Not Relevant 36%, Time Conflict 29%, Cost/Insurance 18%, Transportation 16%.
What We Learned (Synthesis)
Opportunities (slide 005)
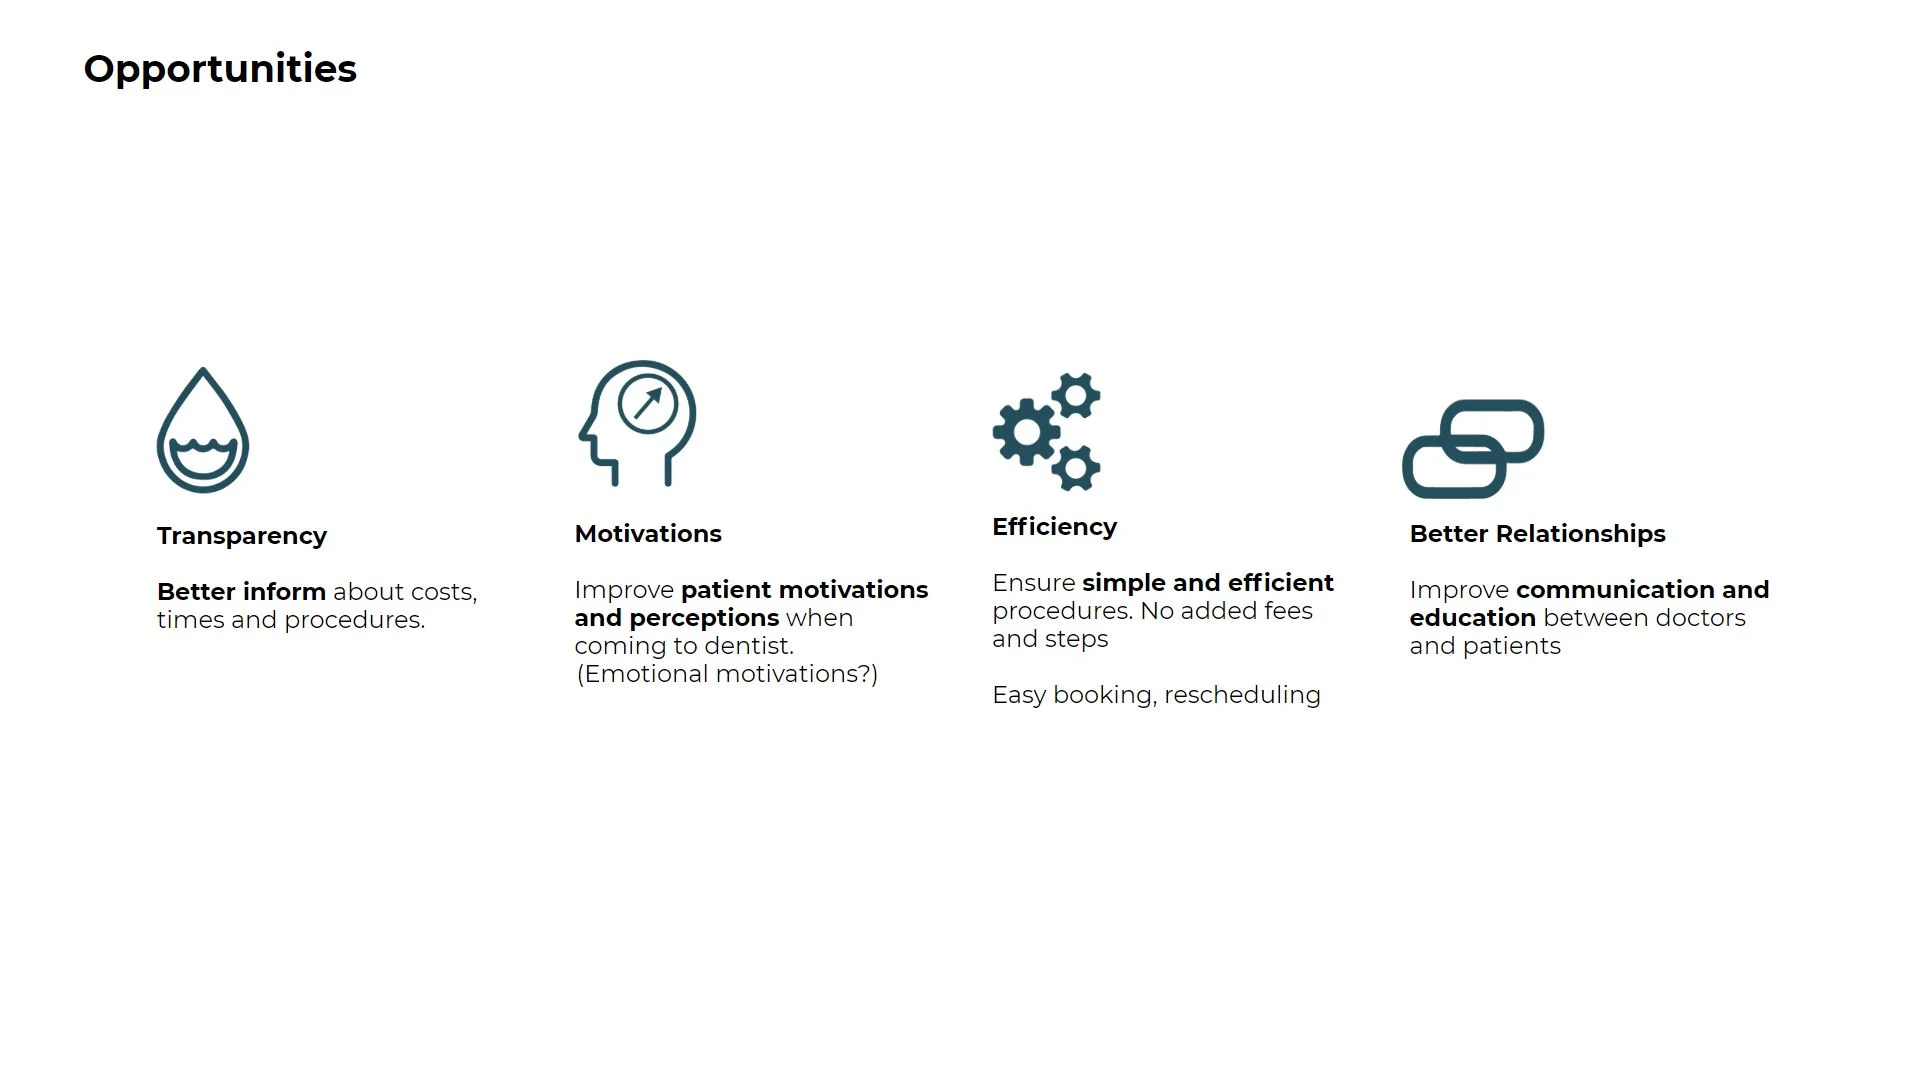
- Transparency — "Better inform about costs, times and procedures."
- Motivations — "Improve patient motivations and perceptions when coming to dentist. (Emotional motivations?)"
- Efficiency — "Ensure simple and efficient procedures. No added fees and steps" / "Easy booking, rescheduling"
- Better Relationships — "Improve communication and education between doctors and patients"
Emotion word cloud (slide 009)
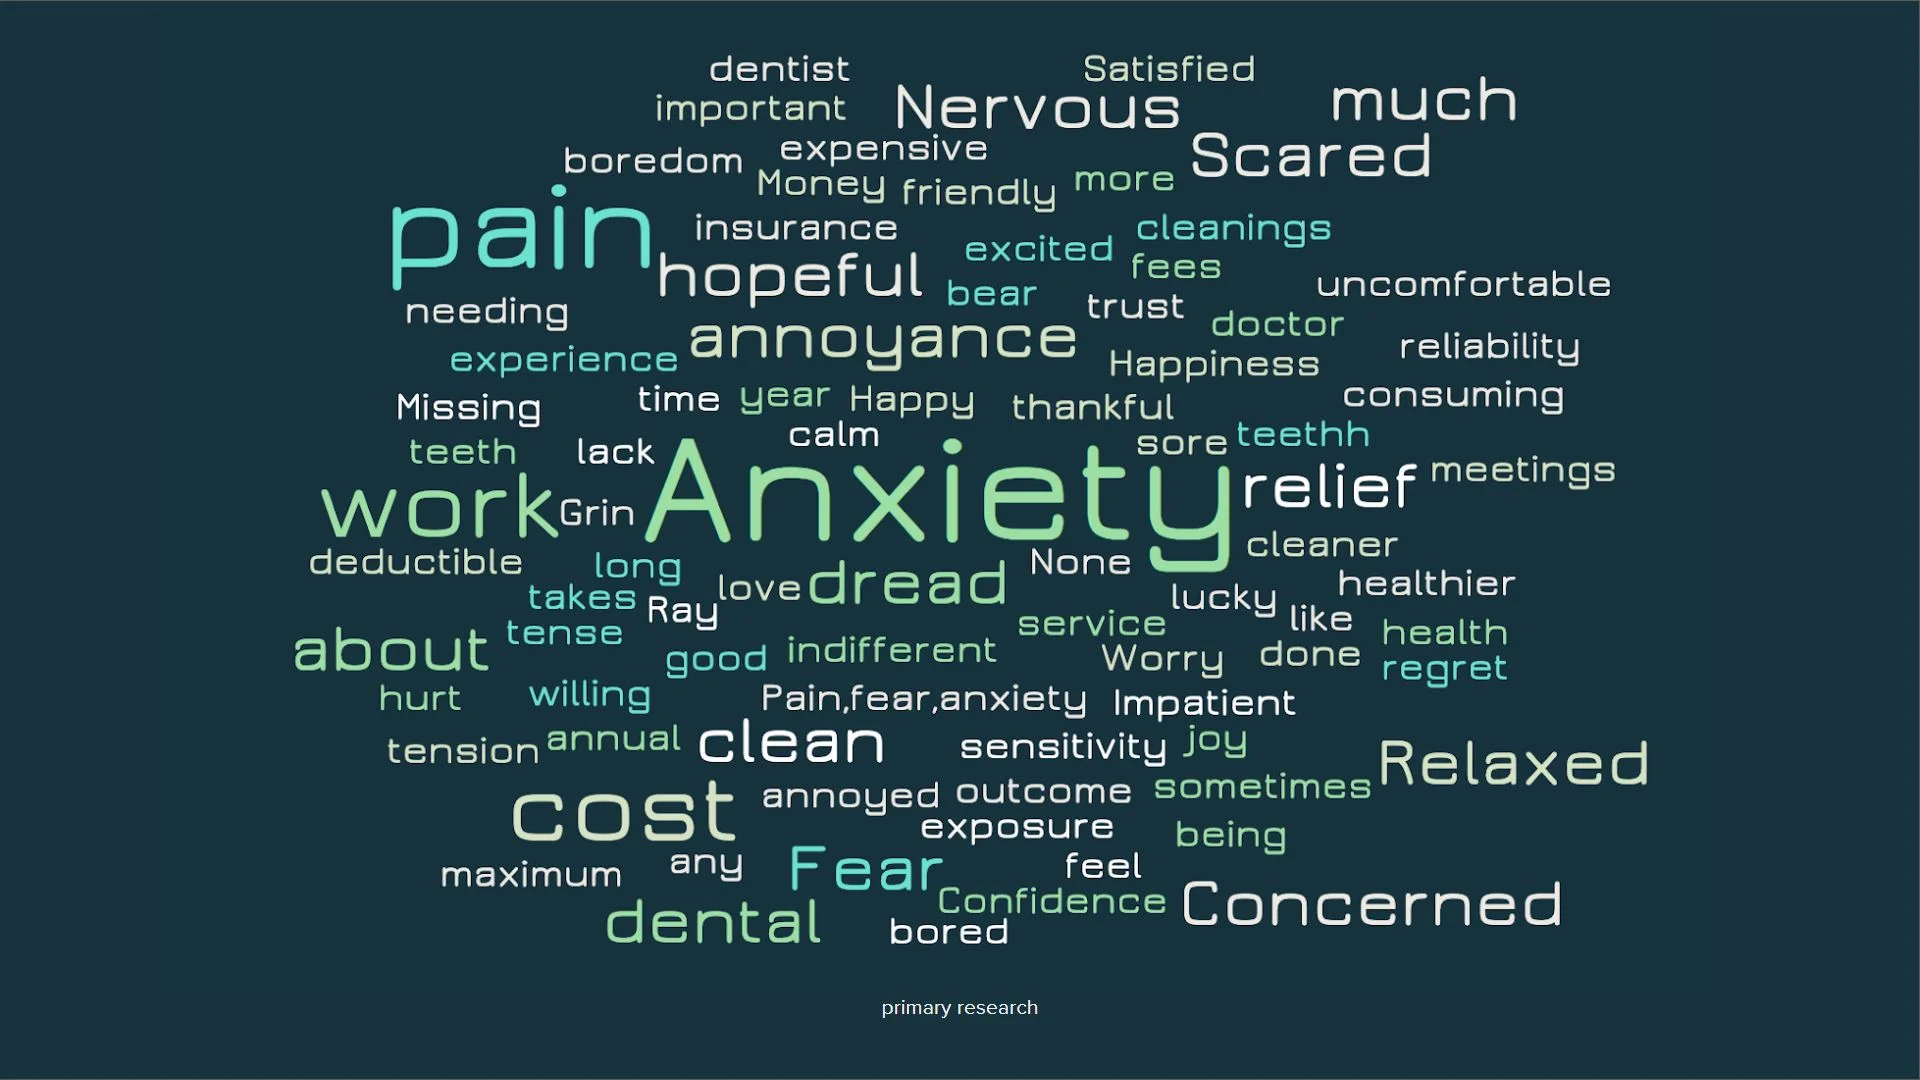 Largest words: Anxiety, pain, work, cost, hopeful, annoyance, Scared, Nervous, dread, dental, Fear, Concerned, Relaxed, clean. Many smaller supporting words (expensive, insurance, trust, doctor, friendly, teeth, fees, cleanings, happy, thankful, calm, relief, etc.) — good as a literal word-cloud graphic or pull-quote ("Anxiety," "pain," and "dread" were the words patients used most").
Patient stakeholder/ecosystem map (slide 012)
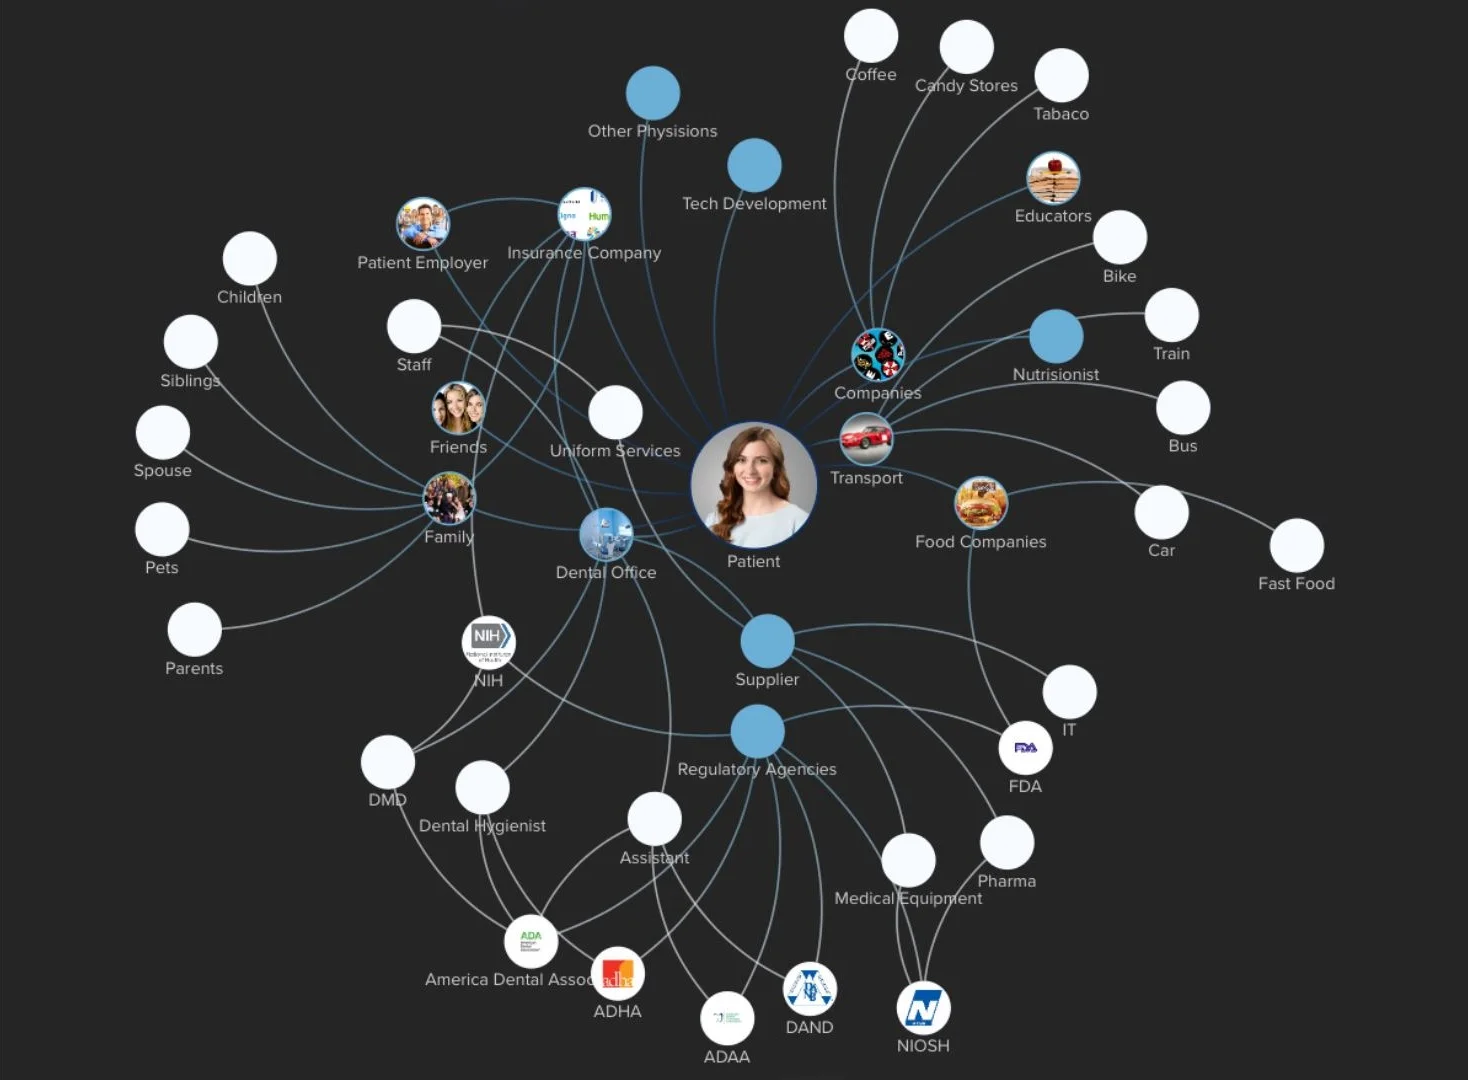 Patient at center, radiating to: Personal circle (Children, Siblings, Spouse, Pets, Parents, Family, Friends, Staff); Care circle (Insurance Company, Patient Employer, Dental Office, Uniform Services, Other Physicians, Nutritionist, Tech Development); Dental industry/regulatory circle (NIH, DMD, Dental Hygienist, Assistant, Regulatory Agencies, ADA, ADHA, ADAA, DAND, NIOSH, FDA, Medical Equipment, Pharma, IT, Supplier); Lifestyle/consumer circle (Companies, Transport, Car, Bus, Train, Bike, Food Companies, Fast Food, Candy Stores, Tobacco, Coffee, Educators).
Customer Journey Map (whiteboard, slide 028)
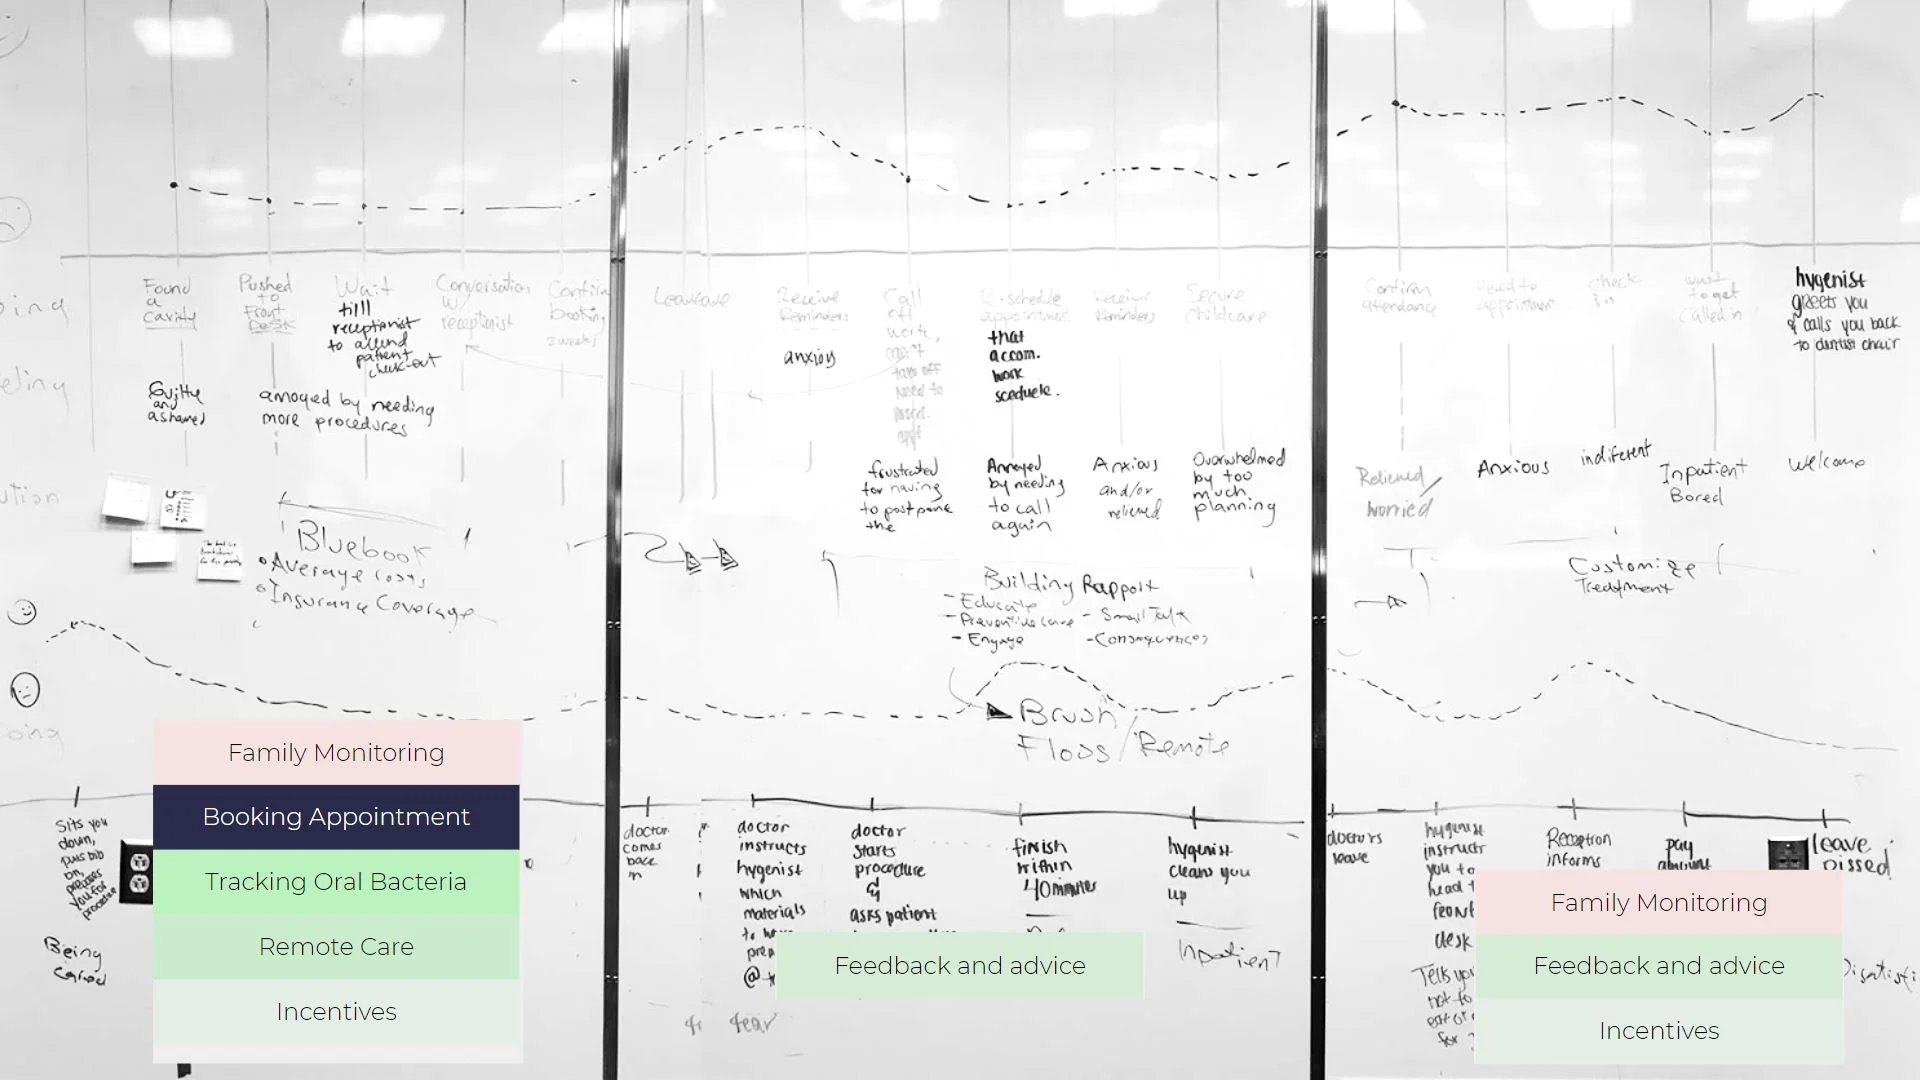 Touchpoints: Found a cavity → Pushed to front desk → Wait for receptionist → Conversation w/ receptionist → Confirm booking (2 weeks) → Leave → Receive reminders → Call off work (cost/can't take time off) → Reschedule → Receive reminders → Secure childcare → Confirm attendance → Head to appointment → Check in → Want to forget → Hygienist greets you & calls you back.
Emotions along the way: Guilty and ashamed, annoyed by needing more procedures, anxious, frustrated for having to postpone, annoyed by needing to call again, anxious/relieved, overwhelmed by too much planning, relieved/worried, anxious, indifferent, impatient, bored, welcome.
Feature tags overlaid on the journey: Family Monitoring, Booking Appointment, Tracking Oral Bacteria, Remote Care, Incentives, Feedback and advice.
This is the core research-synthesis artifact tying patient emotional pain points directly to Bita's features — strongly recommend recreating this as a clean digital journey map.
Touchpoints: Found a cavity → Pushed to front desk → Wait for receptionist → Conversation w/ receptionist → Confirm booking (2 weeks) → Leave → Receive reminders → Call off work (cost/can't take time off) → Reschedule → Receive reminders → Secure childcare → Confirm attendance → Head to appointment → Check in → Want to forget → Hygienist greets you & calls you back.
Emotions along the way: Guilty and ashamed, annoyed by needing more procedures, anxious, frustrated for having to postpone, annoyed by needing to call again, anxious/relieved, overwhelmed by too much planning, relieved/worried, anxious, indifferent, impatient, bored, welcome.
Feature tags overlaid on the journey: Family Monitoring, Booking Appointment, Tracking Oral Bacteria, Remote Care, Incentives, Feedback and advice.
This is the core research-synthesis artifact tying patient emotional pain points directly to Bita's features — strongly recommend recreating this as a clean digital journey map.
From Insight to Idea (Ideation)
Gagne's 9 Steps of Instruction (slide 008)
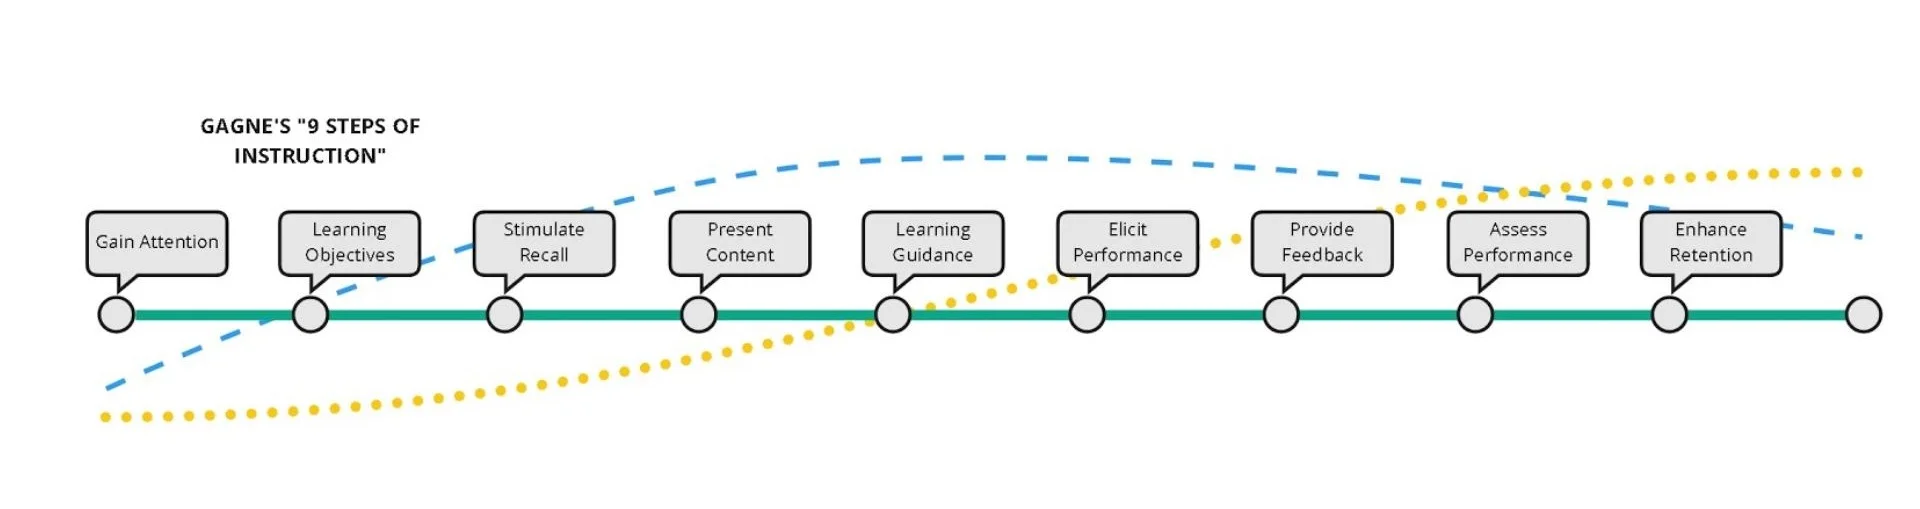 Used as a framework lens: Gain Attention → Learning Objectives → Stimulate Recall → Present Content → Learning Guidance → Elicit Performance → Provide Feedback → Assess Performance → Enhance Retention.
Ideation & Decision Matrix (slide 010)
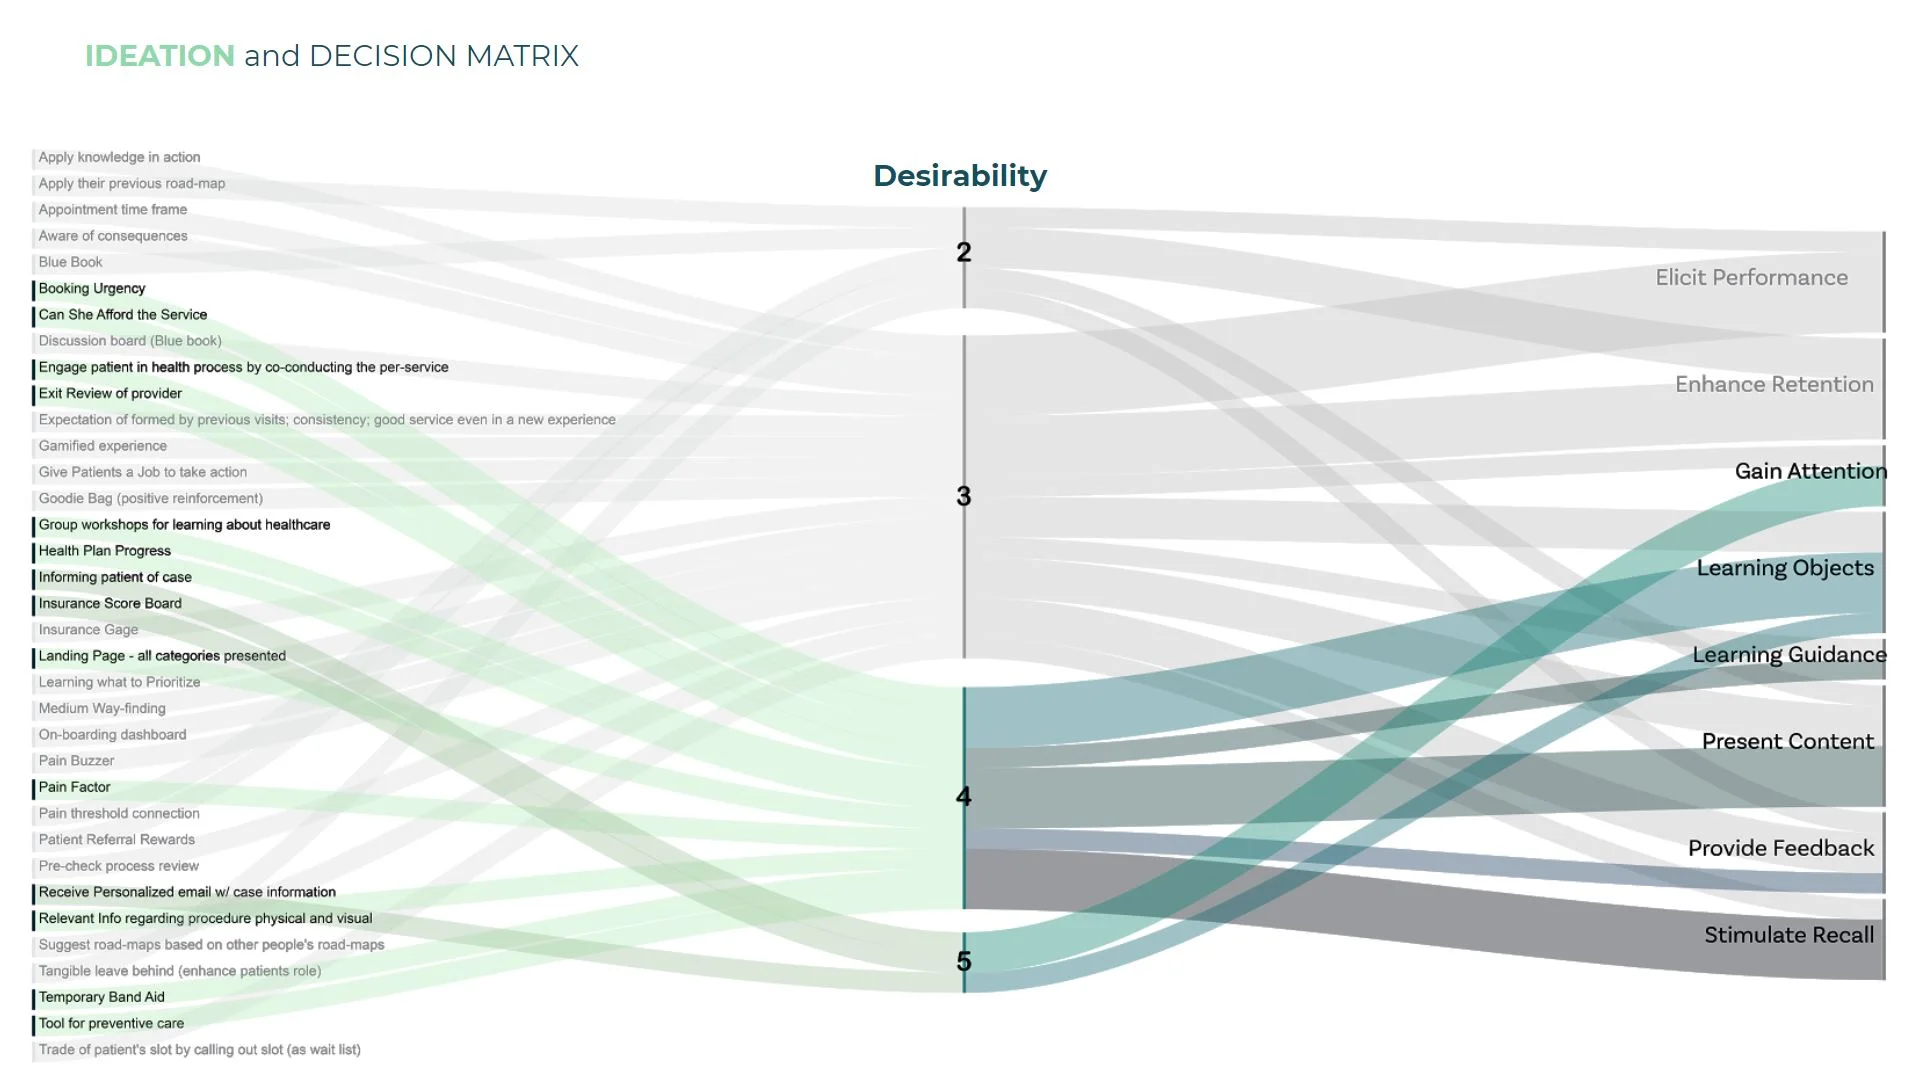 Brainstormed concepts rated by desirability (2–5), mapped to the Gagne steps. Higher-priority/highlighted concepts: Booking Urgency, Can She Afford the Service, Engage patient in health process by co-conducting the per-service, Exit Review of provider, Group workshops for learning about healthcare, Health Plan Progress, Informing patient of case, Insurance Score Board, Landing Page - all categories presented, Receive Personalized email w/ case information, Relevant Info regarding procedure physical and visual, Temporary Band Aid, Tool for preventive care.
Defining the Solution
Value Proposition Canvas (slide 013)
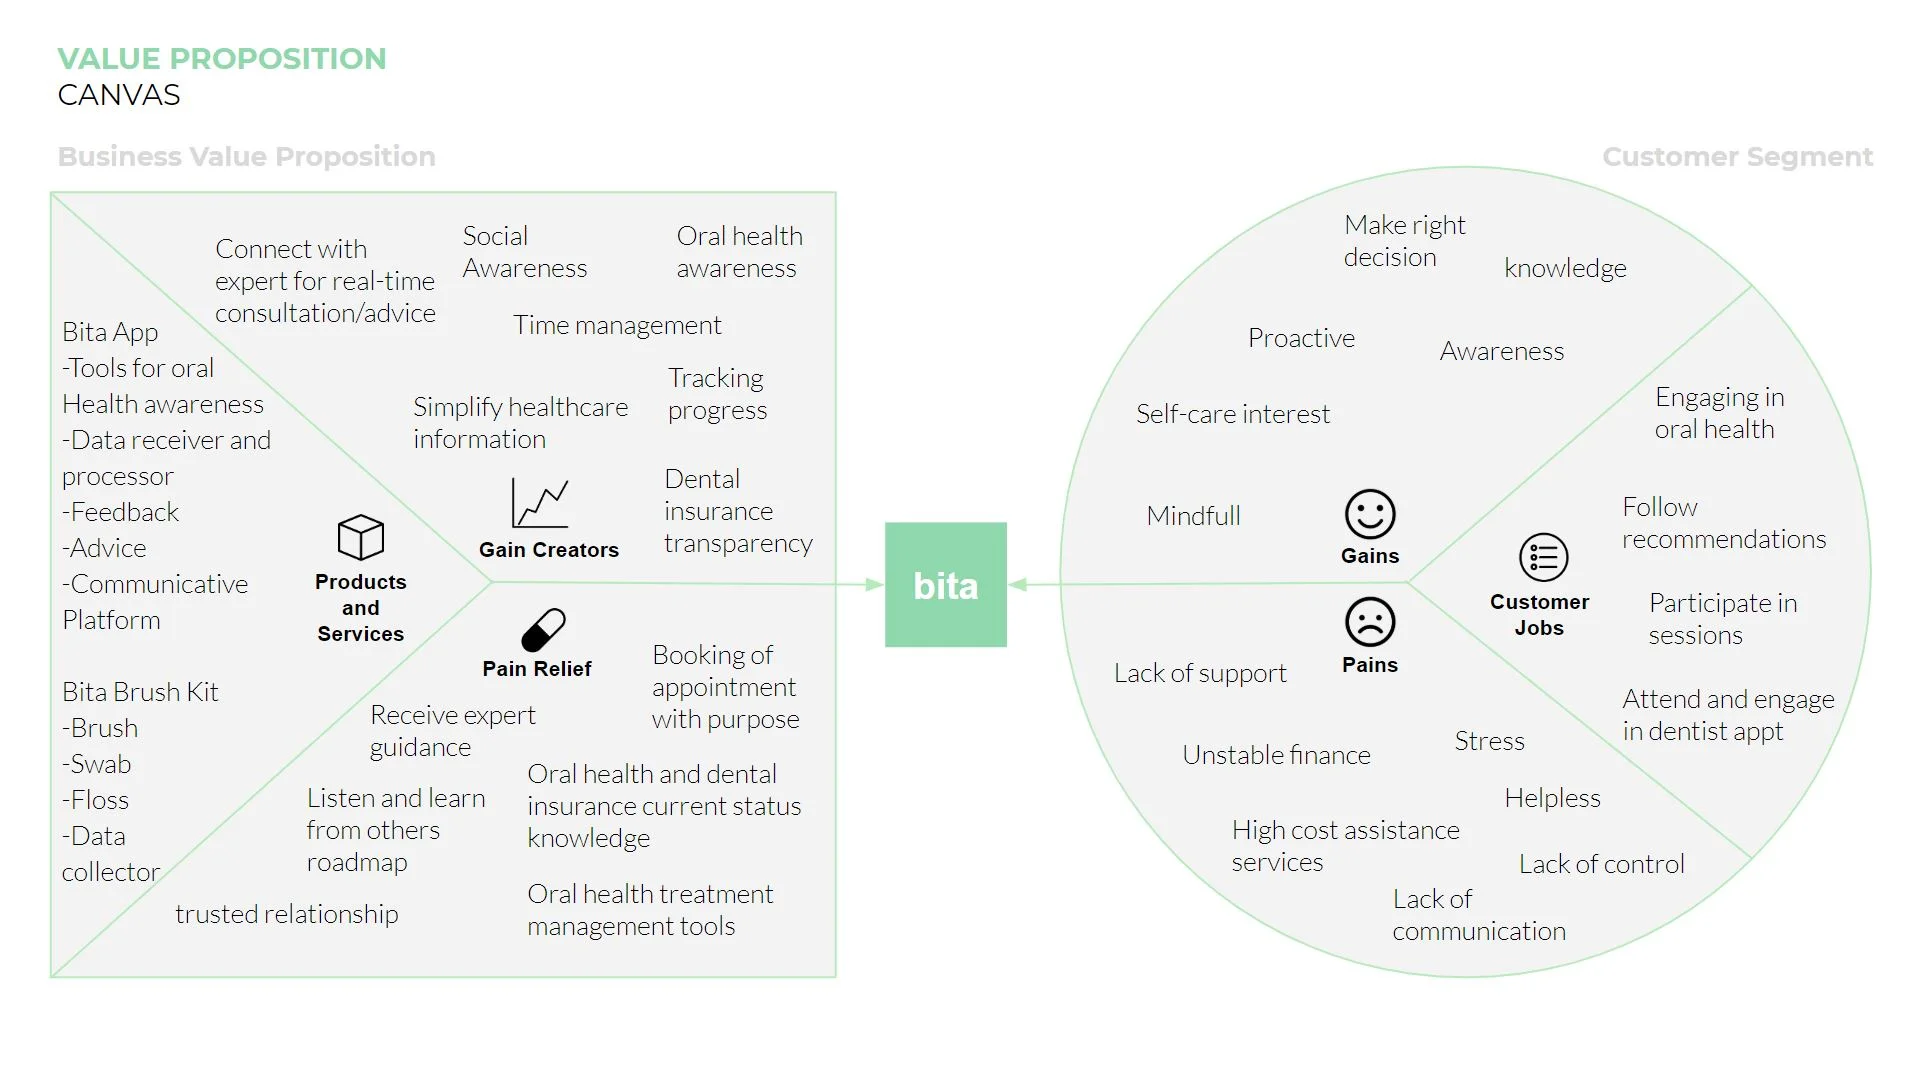 Business side — Products/Services: "Bita App - Tools for oral Health awareness - Data receiver and processor - Feedback - Advice - Communicative Platform"; "Bita Brush Kit - Brush - Swab - Floss - Data collector."
Gain Creators: Connect with expert for real-time consultation/advice; Social Awareness; Oral health awareness; Time management; Simplify healthcare information; Tracking progress; Dental insurance transparency.
Pain Relief: Receive expert guidance; Listen and learn from others' roadmap; trusted relationship; Booking with purpose; Oral health/insurance status knowledge; treatment management tools.
Customer side — Gains: Make right decision; knowledge; Proactive; Awareness; Self-care interest; Mindful; Engaging in oral health; Follow recommendations; Participate in sessions; Attend and engage in dentist appt.
Pains: Lack of support; Unstable finance; High cost assistance services; Lack of communication; Stress; Helpless; Lack of control.
Business side — Products/Services: "Bita App - Tools for oral Health awareness - Data receiver and processor - Feedback - Advice - Communicative Platform"; "Bita Brush Kit - Brush - Swab - Floss - Data collector."
Gain Creators: Connect with expert for real-time consultation/advice; Social Awareness; Oral health awareness; Time management; Simplify healthcare information; Tracking progress; Dental insurance transparency.
Pain Relief: Receive expert guidance; Listen and learn from others' roadmap; trusted relationship; Booking with purpose; Oral health/insurance status knowledge; treatment management tools.
Customer side — Gains: Make right decision; knowledge; Proactive; Awareness; Self-care interest; Mindful; Engaging in oral health; Follow recommendations; Participate in sessions; Attend and engage in dentist appt.
Pains: Lack of support; Unstable finance; High cost assistance services; Lack of communication; Stress; Helpless; Lack of control.
Musts, Satisfiers & Delights (slide 014)
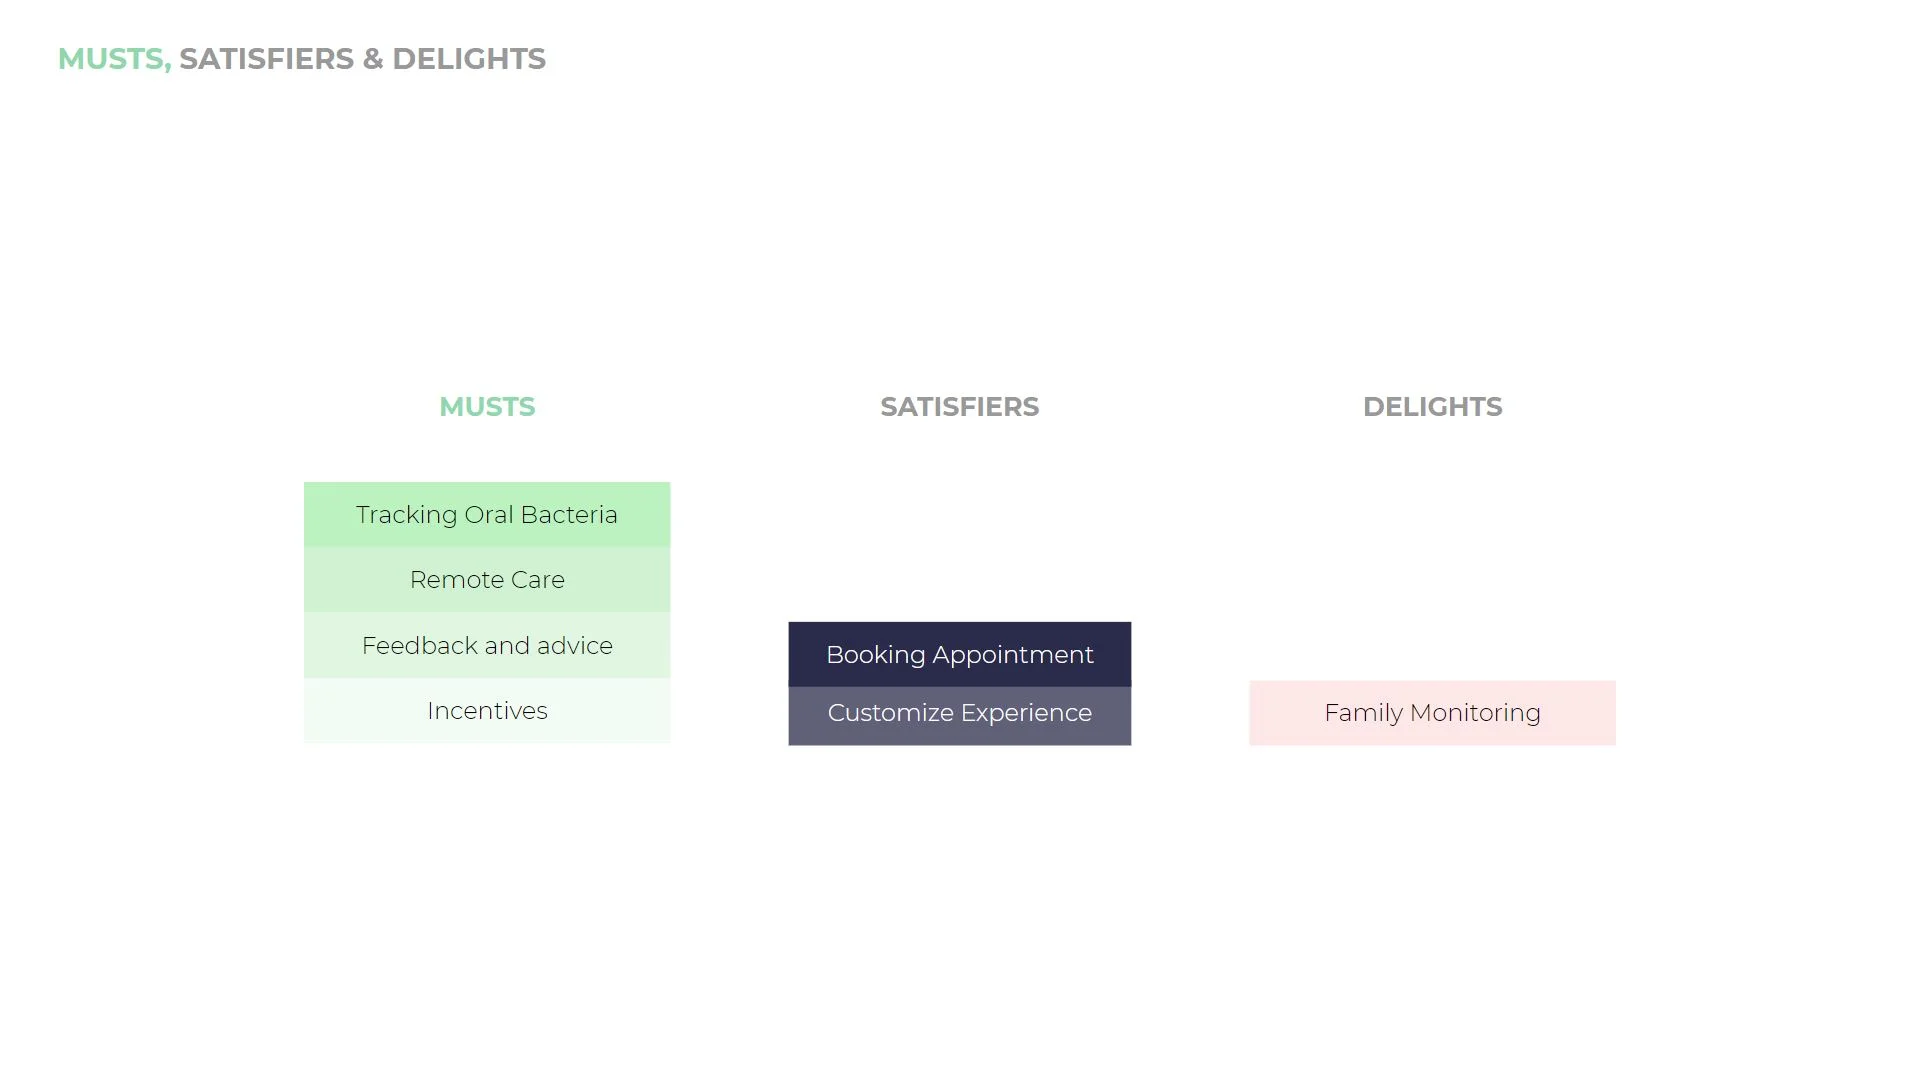 Musts: Tracking Oral Bacteria; Remote Care; Feedback and advice; Incentives.
Satisfiers: Booking Appointment; Customize Experience.
Delights: Family Monitoring.
Musts: Tracking Oral Bacteria; Remote Care; Feedback and advice; Incentives.
Satisfiers: Booking Appointment; Customize Experience.
Delights: Family Monitoring.
Solution Space (slide 030)
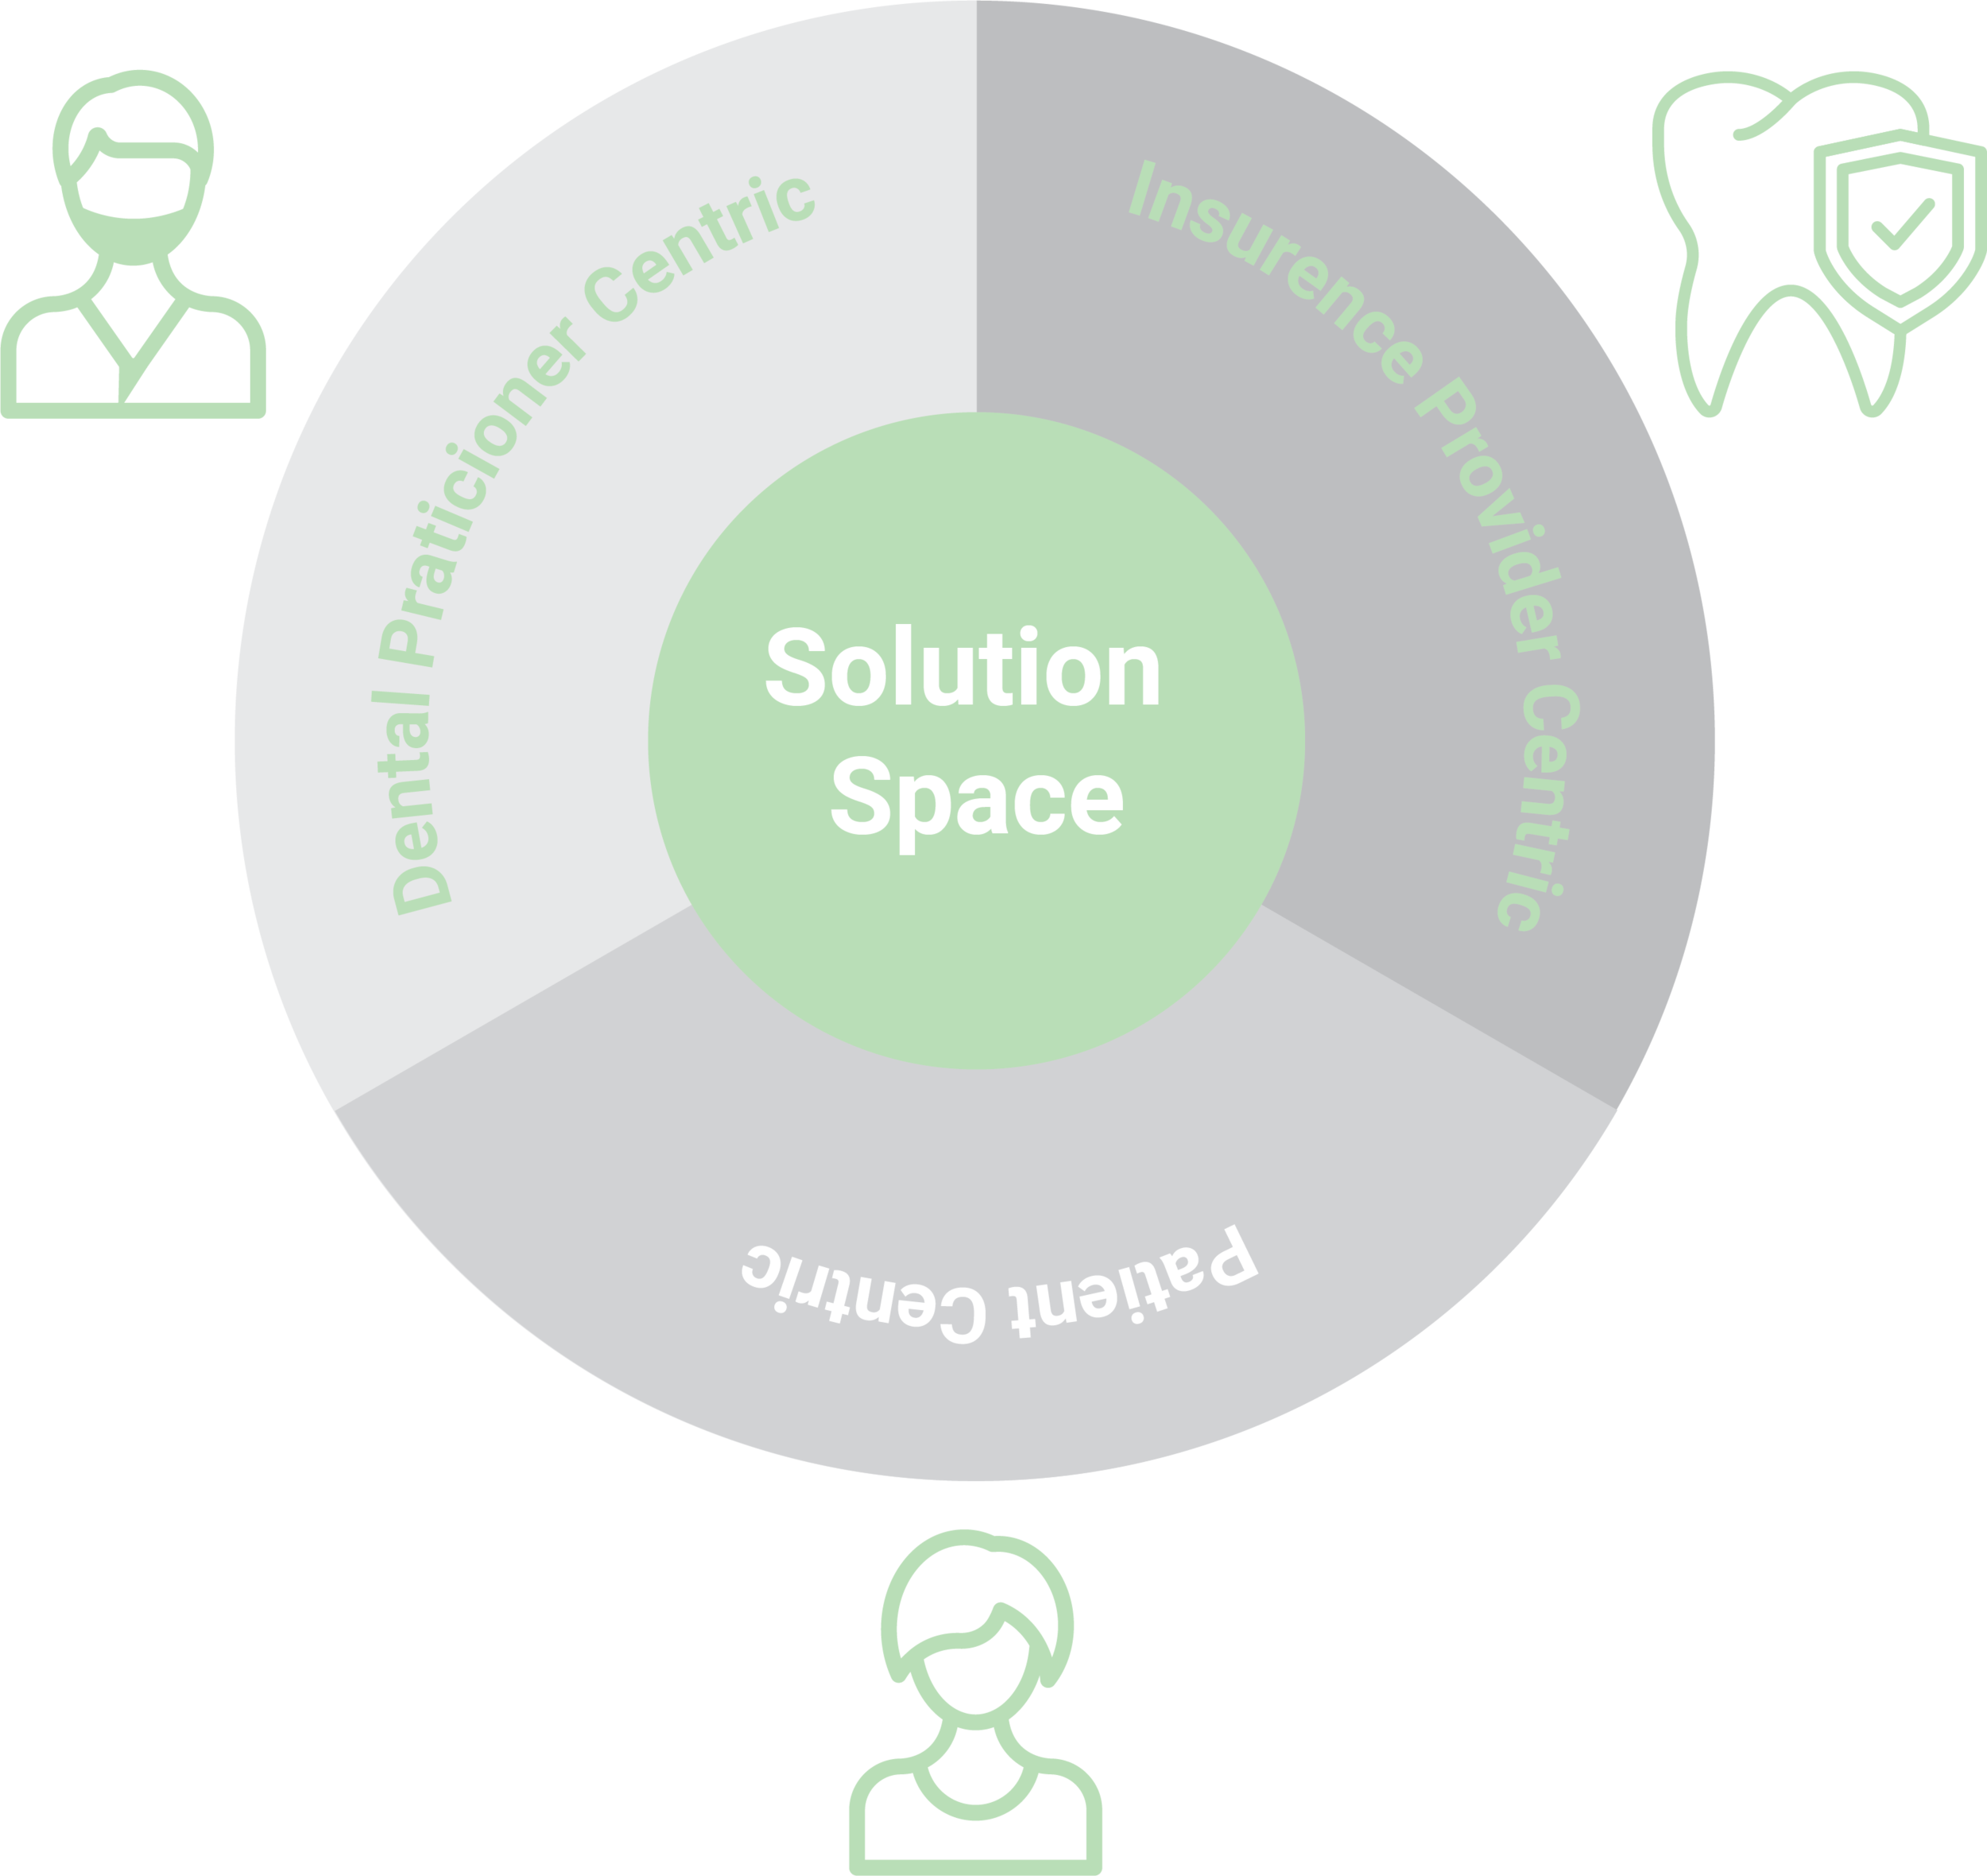 Three-way diagram: Dental Practitioner Centric / Insurance Provider Centric / Patient Centric, meeting at "Solution Space" — frames Bita as sitting at the intersection of all three stakeholders' needs.
The Bita Service
Service package (slide 015)
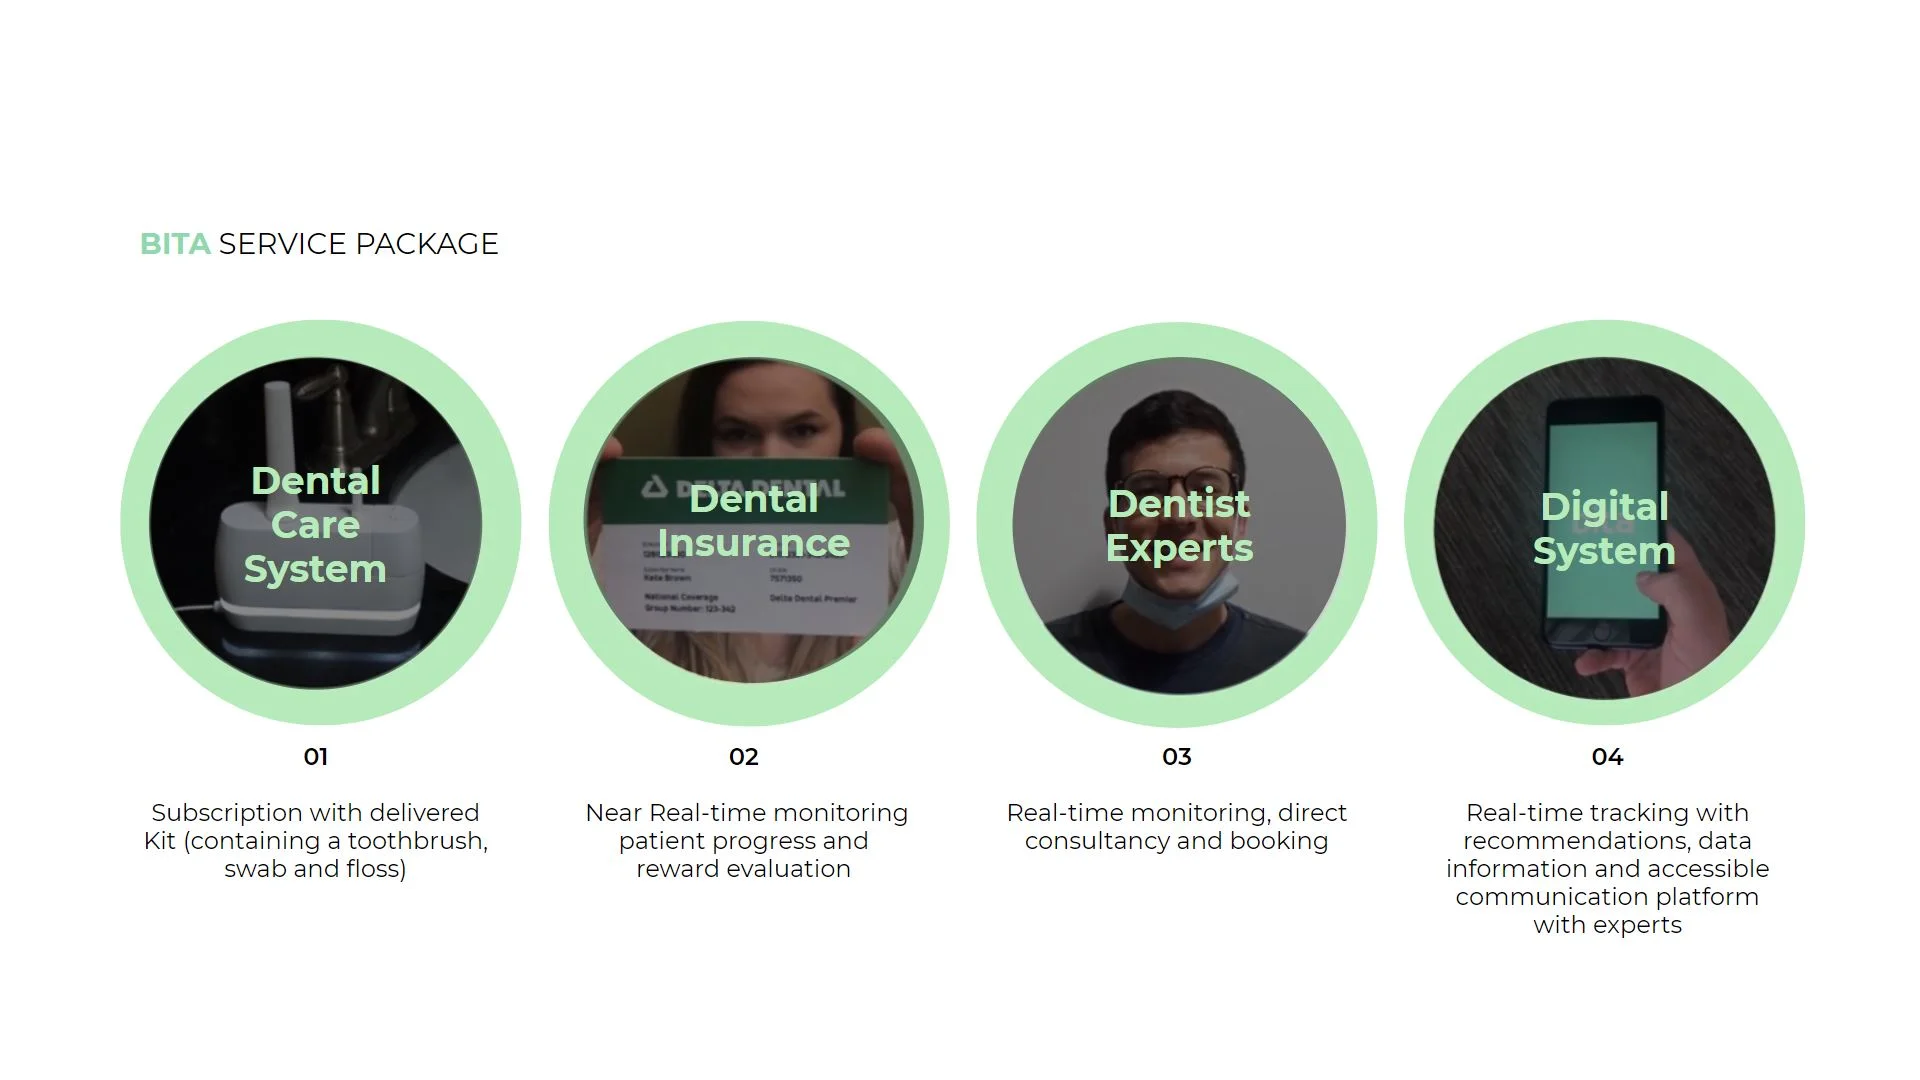
- Dental Care System — "Subscription with delivered Kit (containing a toothbrush, swab and floss)"
- Dental Insurance — "Near Real-time monitoring patient progress and reward evaluation"
- Dentist Experts — "Real-time monitoring, direct consultancy and booking"
- Digital System — "Real-time tracking with recommendations, data information and accessible communication platform with experts"
Physical prototype — built on a Philips Sonicare base (slide 016)
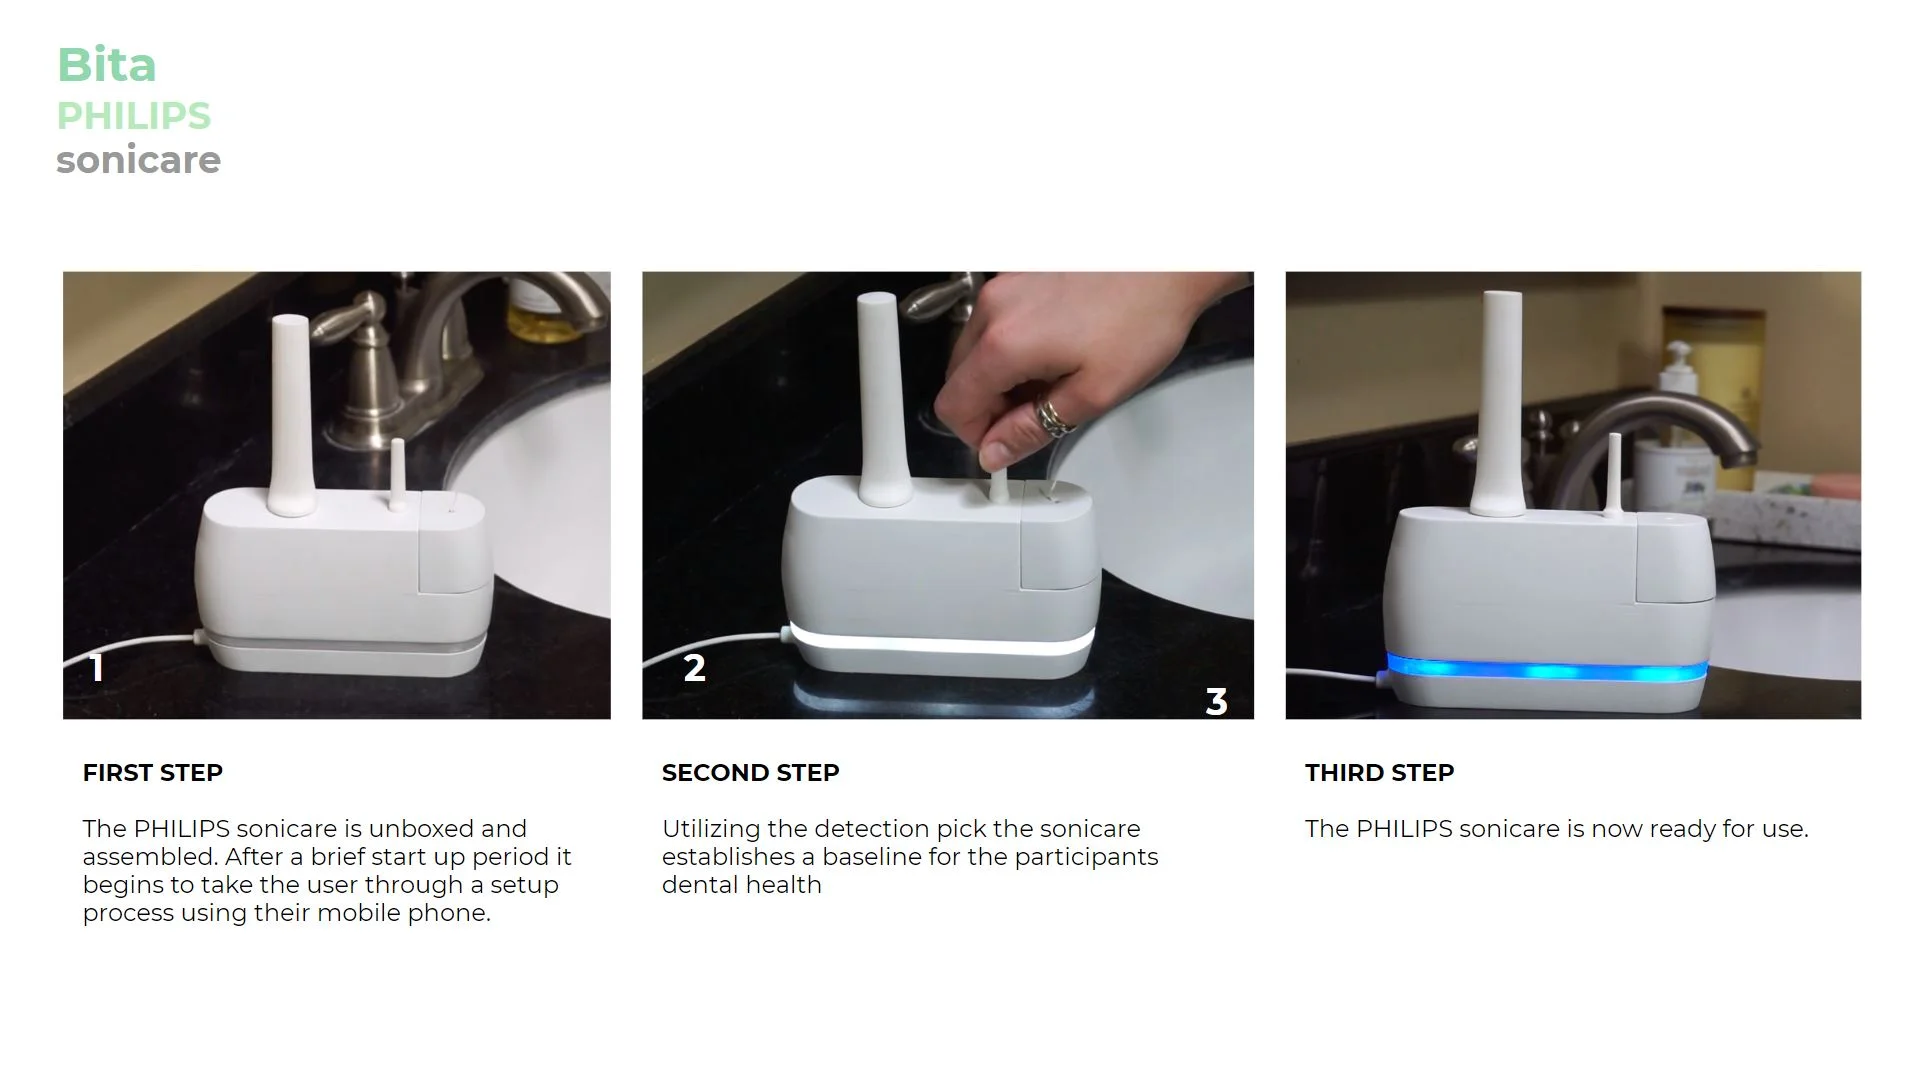 "The PHILIPS sonicare is unboxed and assembled. After a brief start up period it begins to take the user through a setup process using their mobile phone." → "Utilizing the detection pick the sonicare establishes a baseline for the participants dental health." → "The PHILIPS sonicare is now ready for use."
(Real third-party trademarks — Philips Sonicare and Delta Dental — used in mockups/prototype. Flag for the user to decide how to present this in a professional portfolio context: e.g. "prototyped using a modified Philips Sonicare base.")
"The PHILIPS sonicare is unboxed and assembled. After a brief start up period it begins to take the user through a setup process using their mobile phone." → "Utilizing the detection pick the sonicare establishes a baseline for the participants dental health." → "The PHILIPS sonicare is now ready for use."
(Real third-party trademarks — Philips Sonicare and Delta Dental — used in mockups/prototype. Flag for the user to decide how to present this in a professional portfolio context: e.g. "prototyped using a modified Philips Sonicare base.")
The Product — App & Dashboard
Patient app (slide 017)
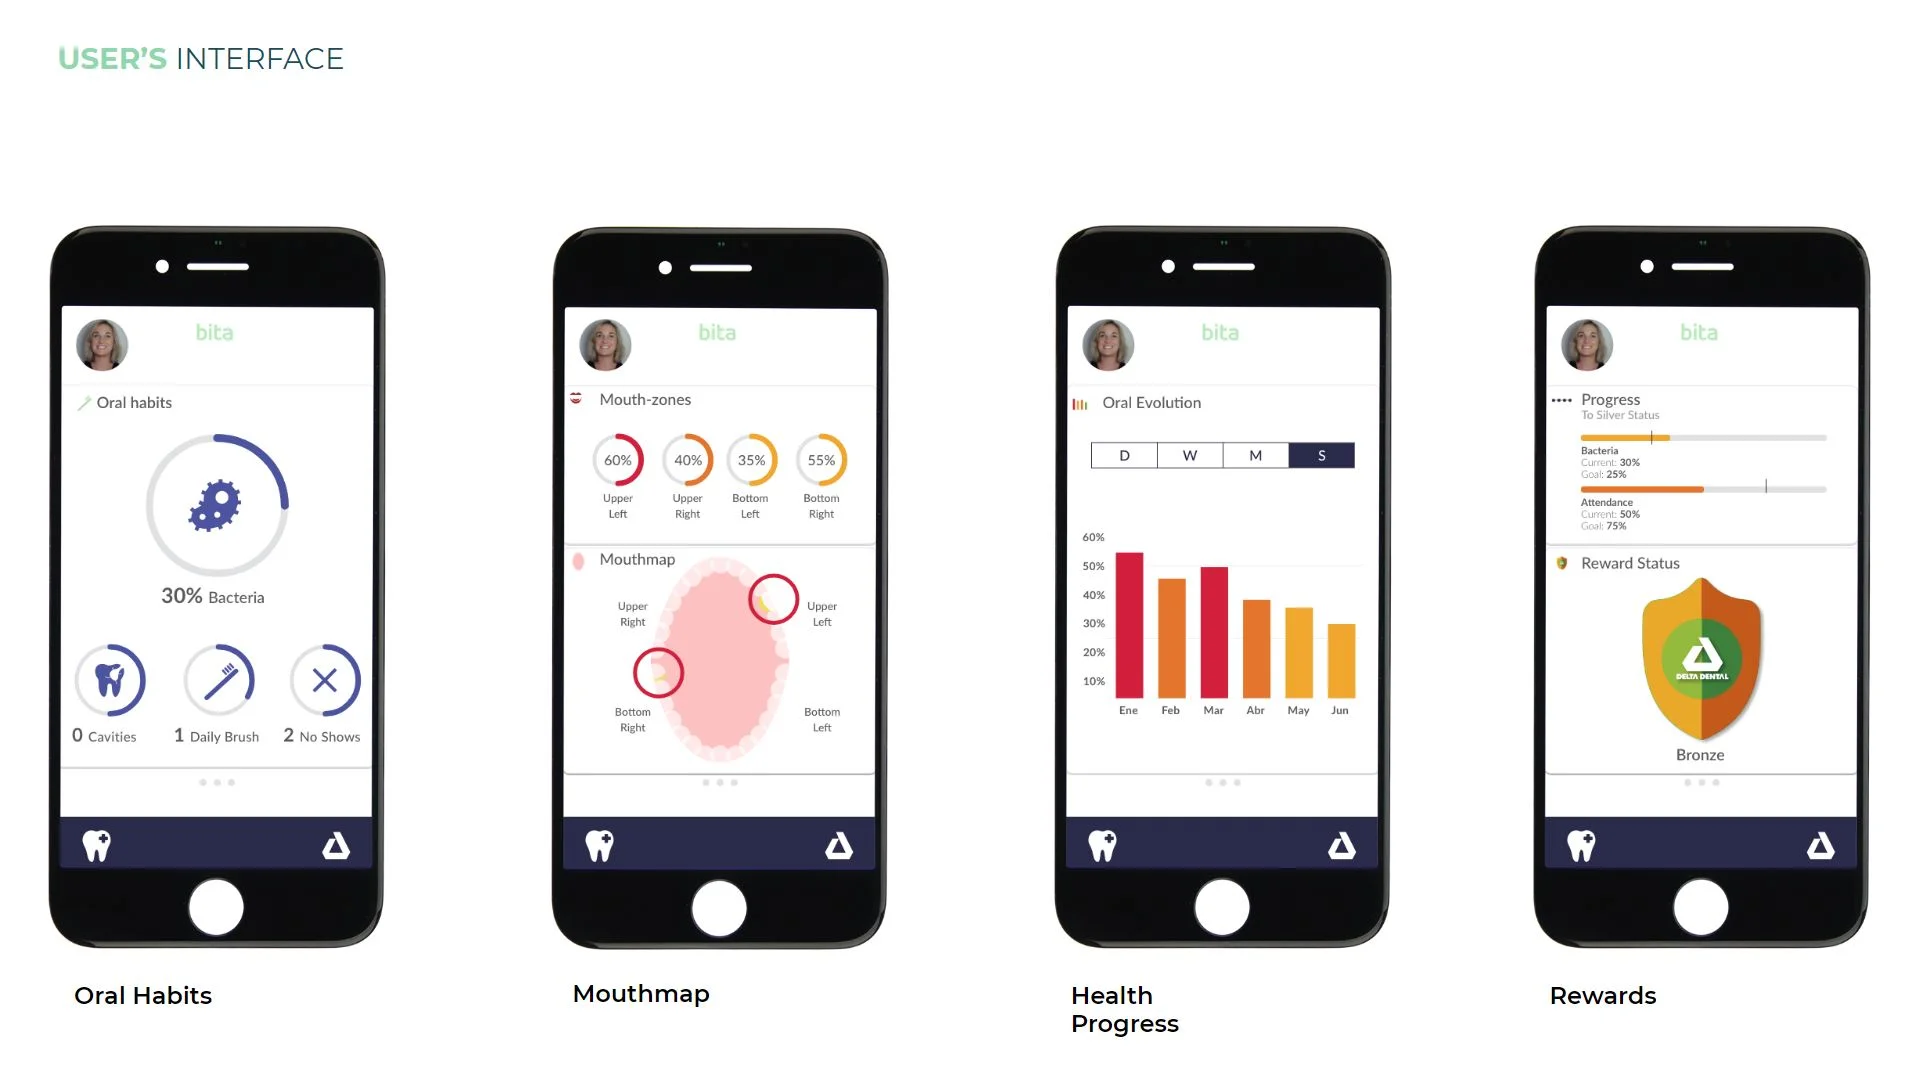
- Oral Habits — circular gauge "30% Bacteria"; stats "0 Cavities," "1 Daily Brush," "2 No Shows"
- Mouthmap — zone percentage rings (Upper Left 60%, Upper Right 40%, Bottom Left 35%, Bottom Right 55%); stylized mouth outline with circled "hot spot" problem areas
- Health Progress — "Oral Evolution" bar chart, Day/Week/Month/Season toggle; Season view shows decline from ~55% to ~30% (Jan–Jun)
- Rewards — progress toward "Silver Status": Bacteria (Current 30%, Goal 25%), Attendance (Current 50%, Goal 75%); Bronze shield badge with Delta Dental logo
Dentist dashboard (slides 018, 027 — same mockup)
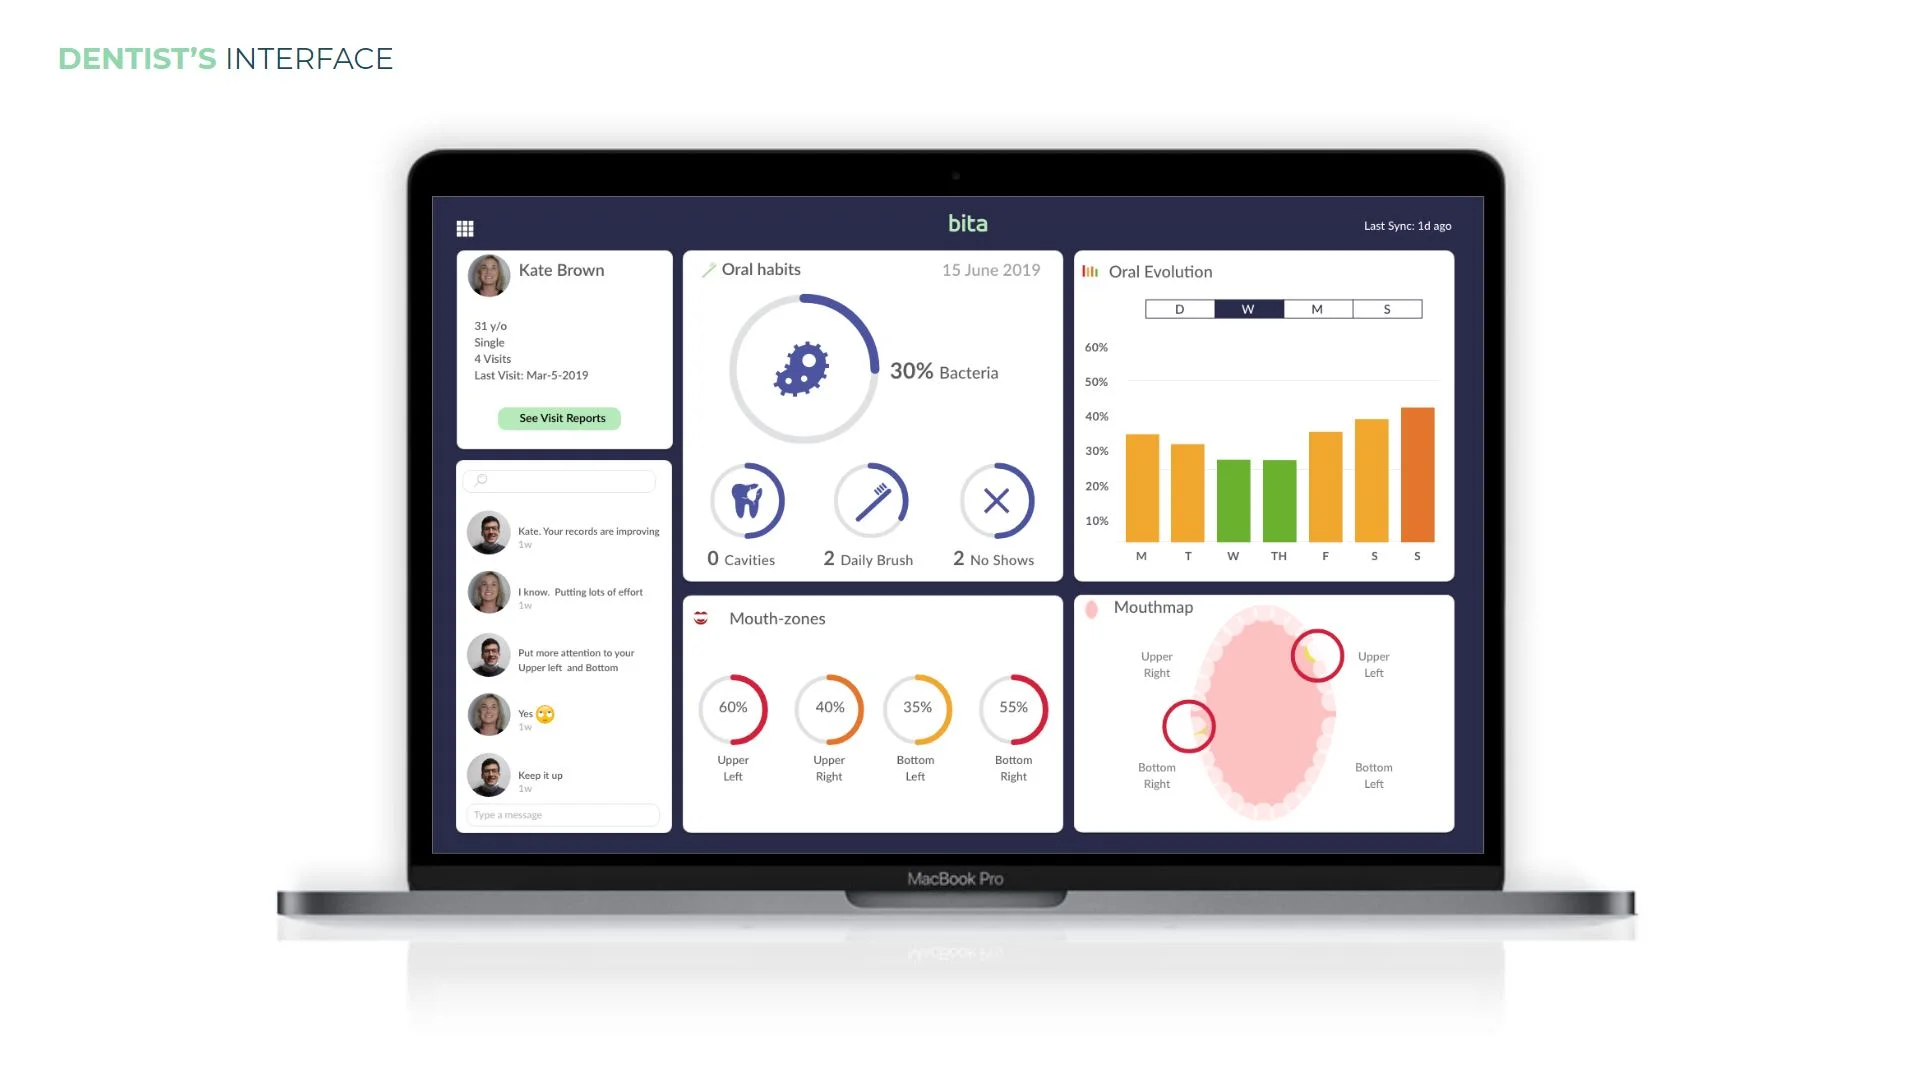
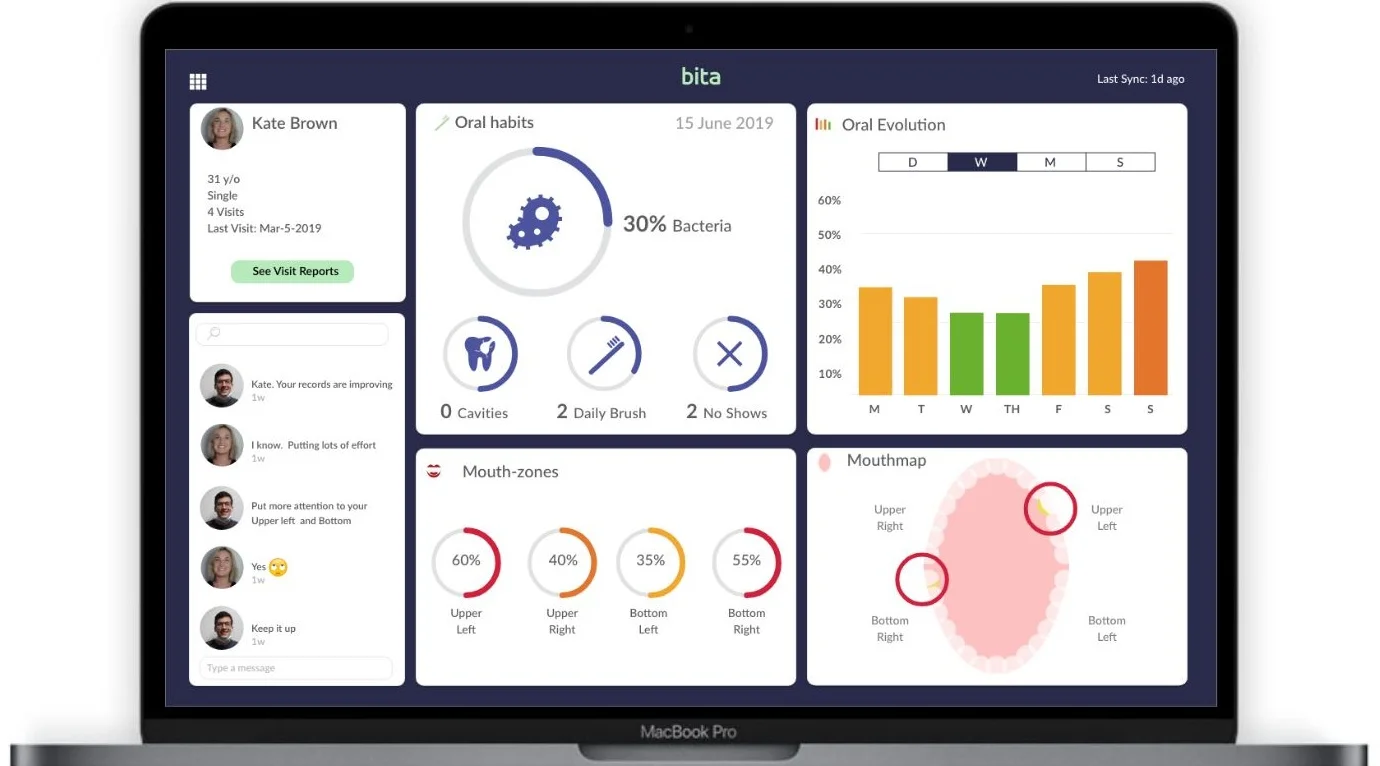 MacBook Pro mockup: patient card "Kate Brown, 31 y/o, Single, 4 Visits, Last Visit: Mar-5-2019"; messaging panel ("Kate. Your records are improving" / "I know. Putting lots of effort" / "Put more attention to your Upper left and Bottom" / "Yes 🙄" / "Keep it up"); same Oral Habits/Oral Evolution/Mouth-zones/Mouthmap panels as the patient app, dated 15 June 2019.
Why It Works for Everyone
Rewards Significance (slide 019)
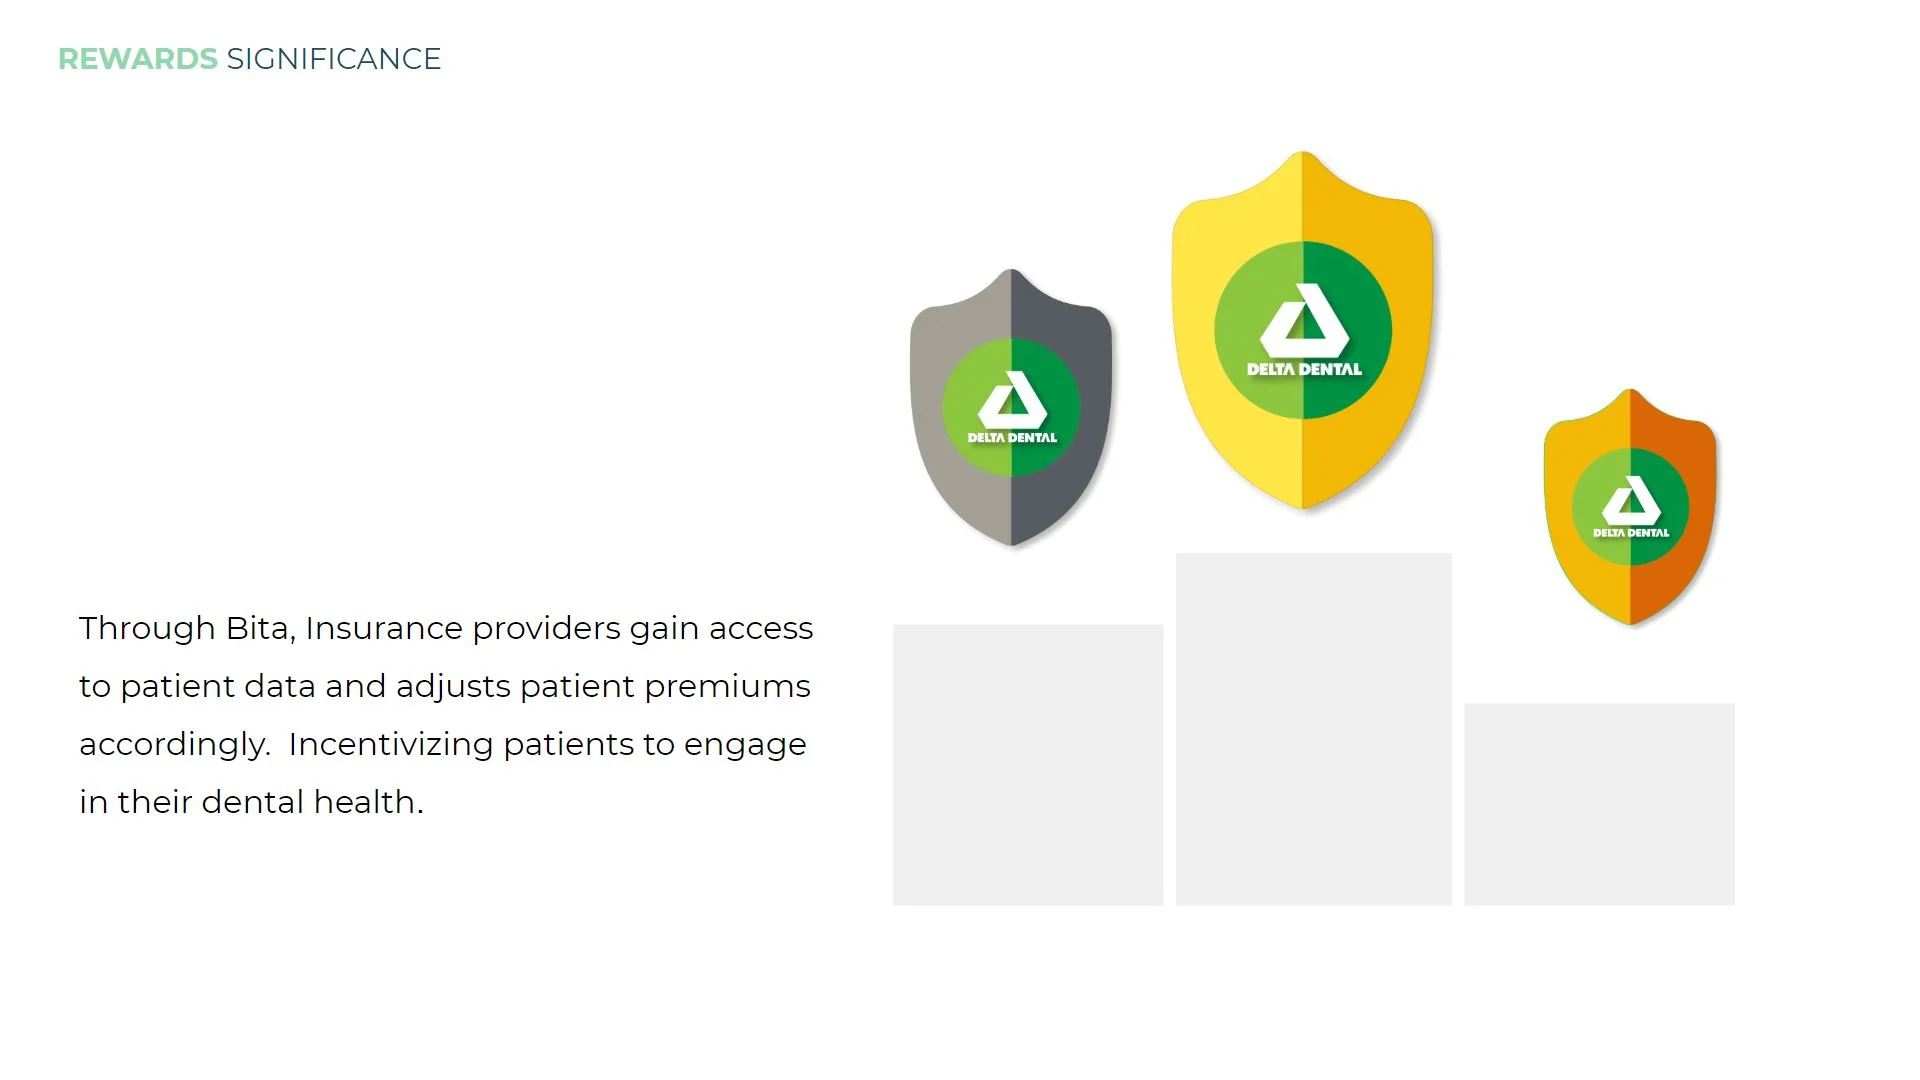 "Through Bita, Insurance providers gain access to patient data and adjusts patient premiums accordingly. Incentivizing patients to engage in their dental health." — three Delta Dental tier badges (silver/gold/bronze).
Applied Service principles (slide 020)
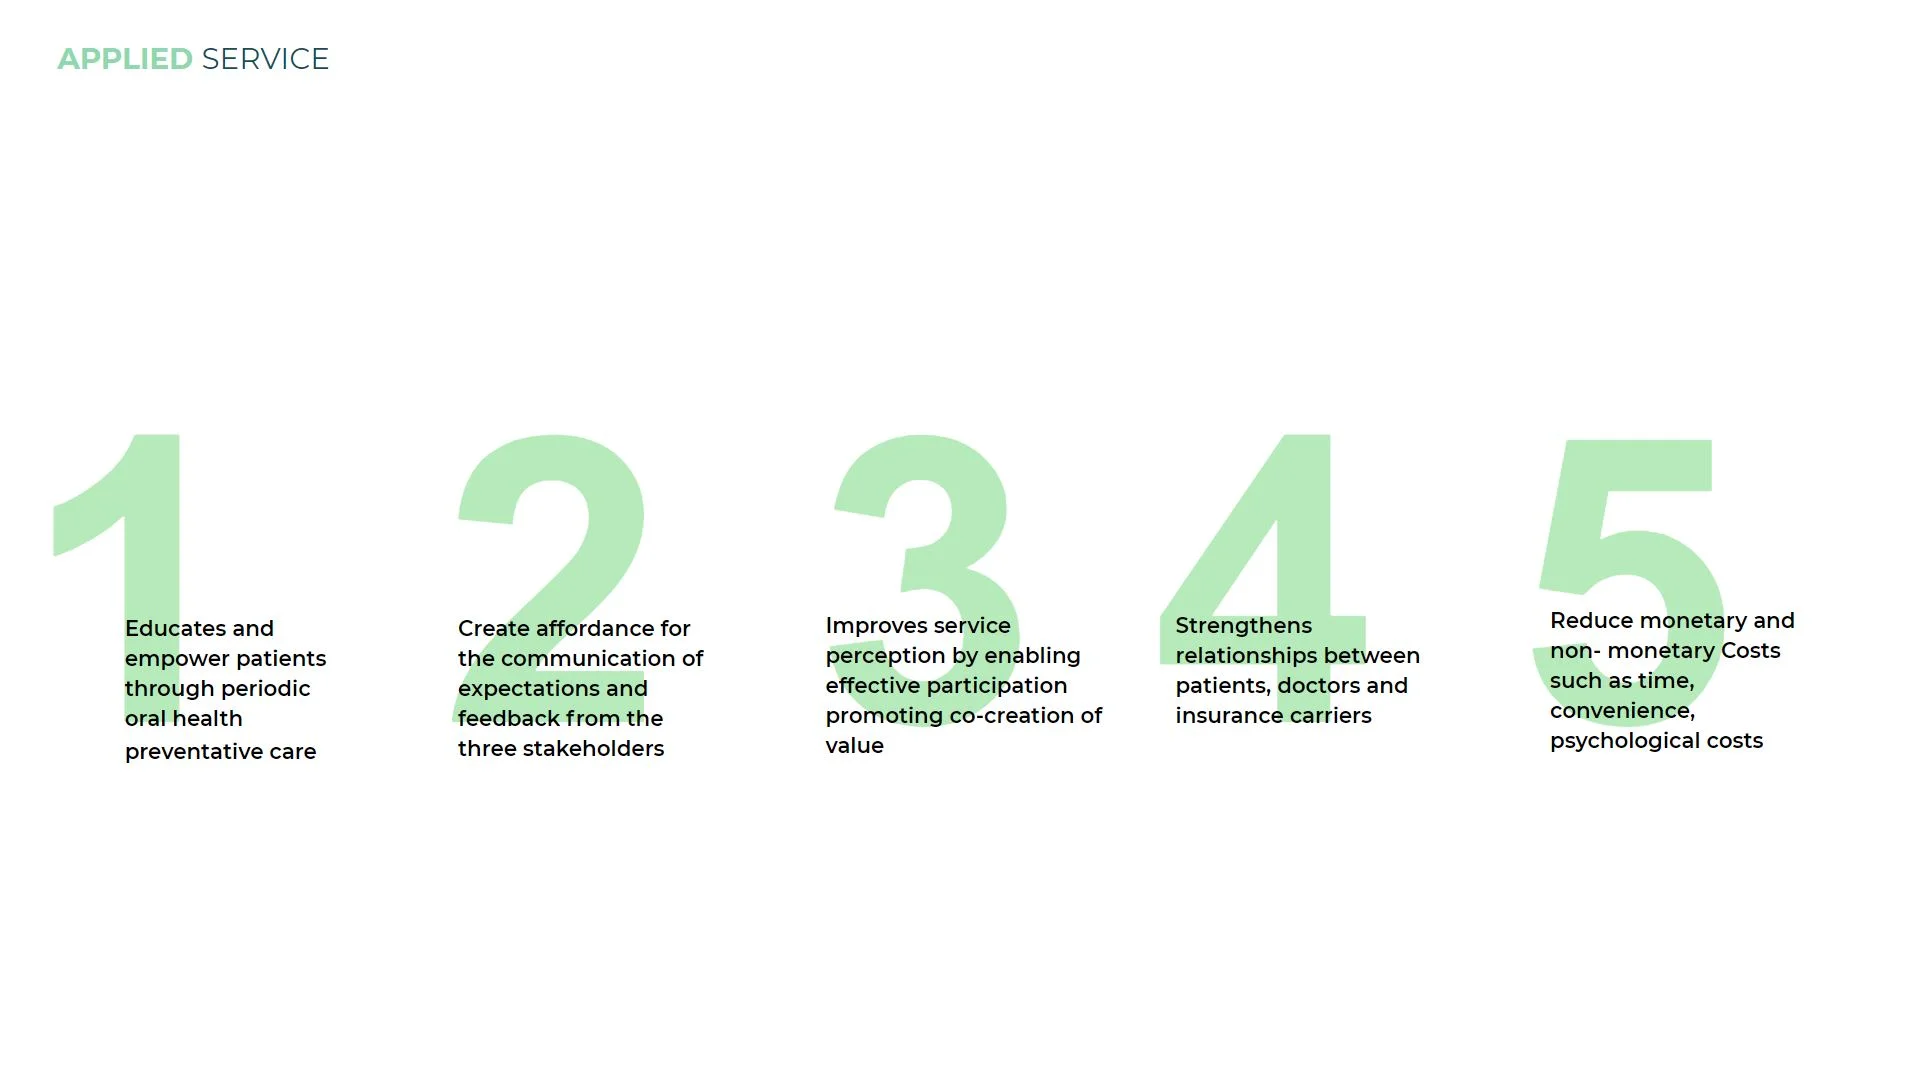
- Educates and empowers patients through periodic oral health preventative care
- Creates affordance for the communication of expectations and feedback from the three stakeholders
- Improves service perception by enabling effective participation promoting co-creation of value
- Strengthens relationships between patients, doctors and insurance carriers
- Reduces monetary and non-monetary costs such as time, convenience, psychological costs
Stakeholder value-exchange diagram (slide 029)
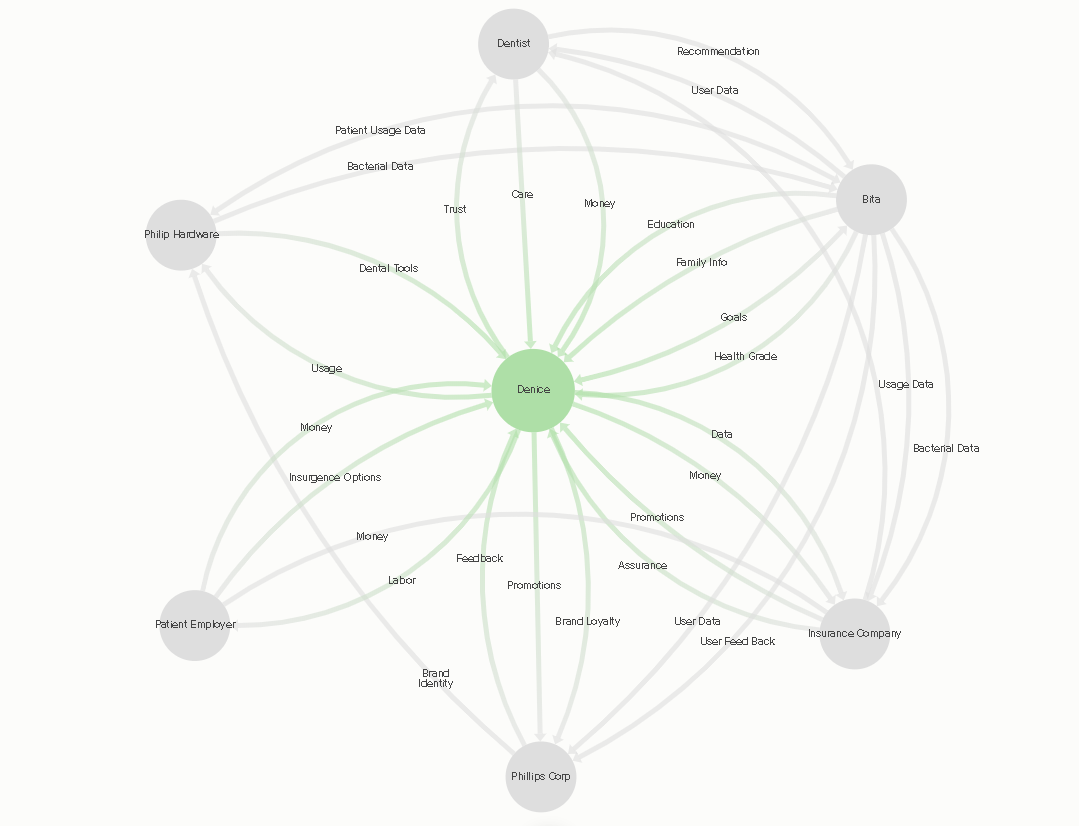 Central node ("Device," likely mislabeled "Denice" in source) connected to Dentist, Bita, Insurance Company, Phillips Corp, Patient Employer, Philips Hardware, with labeled value flows (Recommendation/User Data/Trust/Care with Dentist; Education/Family Info/Goals/Health Grade/Data/Money/Promotions with Bita; Assurance/Brand Loyalty/User Data/User Feedback with Insurance; Feedback/Promotions/Money/Brand Identity with Phillips Corp; Money/Labor with Patient Employer; Usage/Money/Insurance Options/Dental Tools/Patient Usage Data/Bacterial Data with Philips Hardware).
Results (slide 021, likely projected/simulated — see flags)
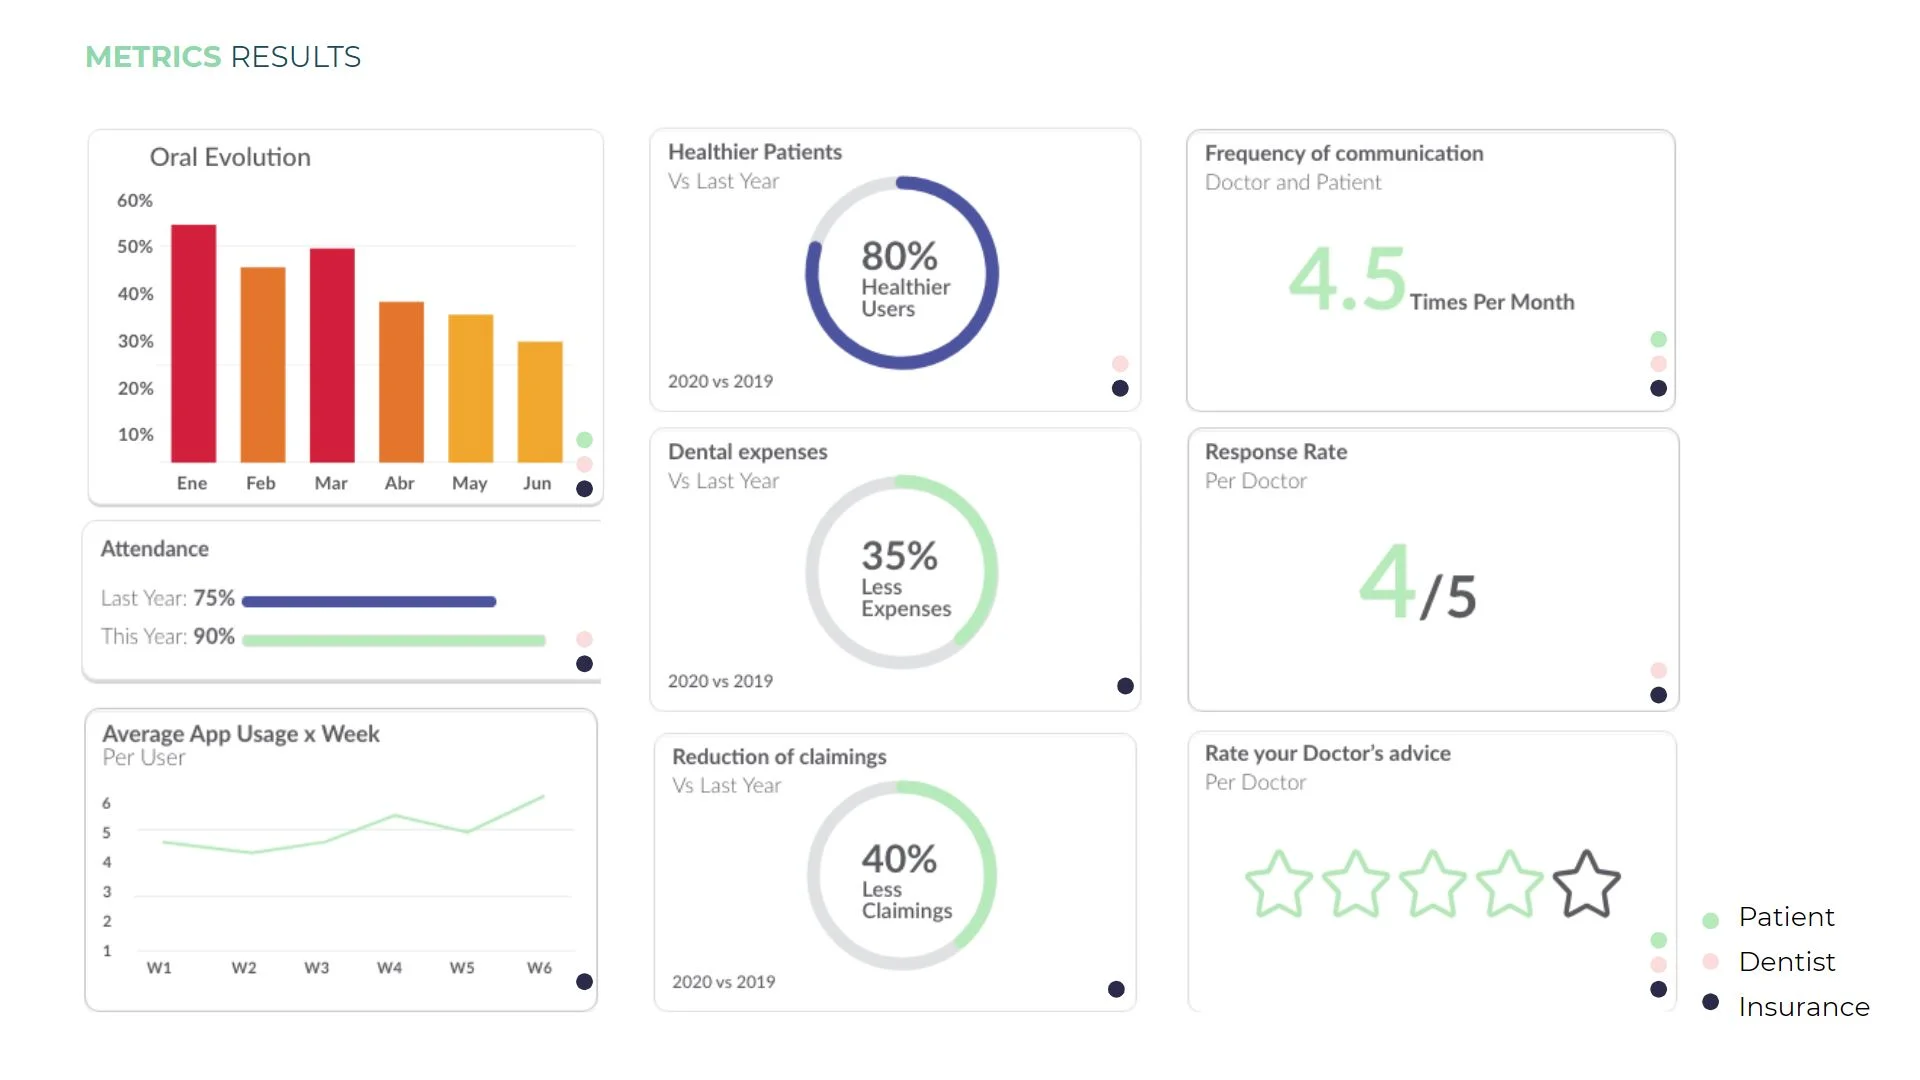
- Oral Evolution: same declining bacteria % chart
- Attendance: Last Year 75% vs This Year 90%
- Average App Usage per Week: rising ~4.5 → ~6 over 6 weeks
- Healthier Patients vs Last Year: 80% Healthier Users
- Dental expenses vs Last Year: 35% Less Expenses
- Reduction of claims vs Last Year: 40% Less Claims
- Frequency of doctor-patient communication: 4.5 times/month
- Response Rate per doctor: 4/5
- Doctor advice rating: 4/5 stars
Process documentation (slides 022–027, 031)
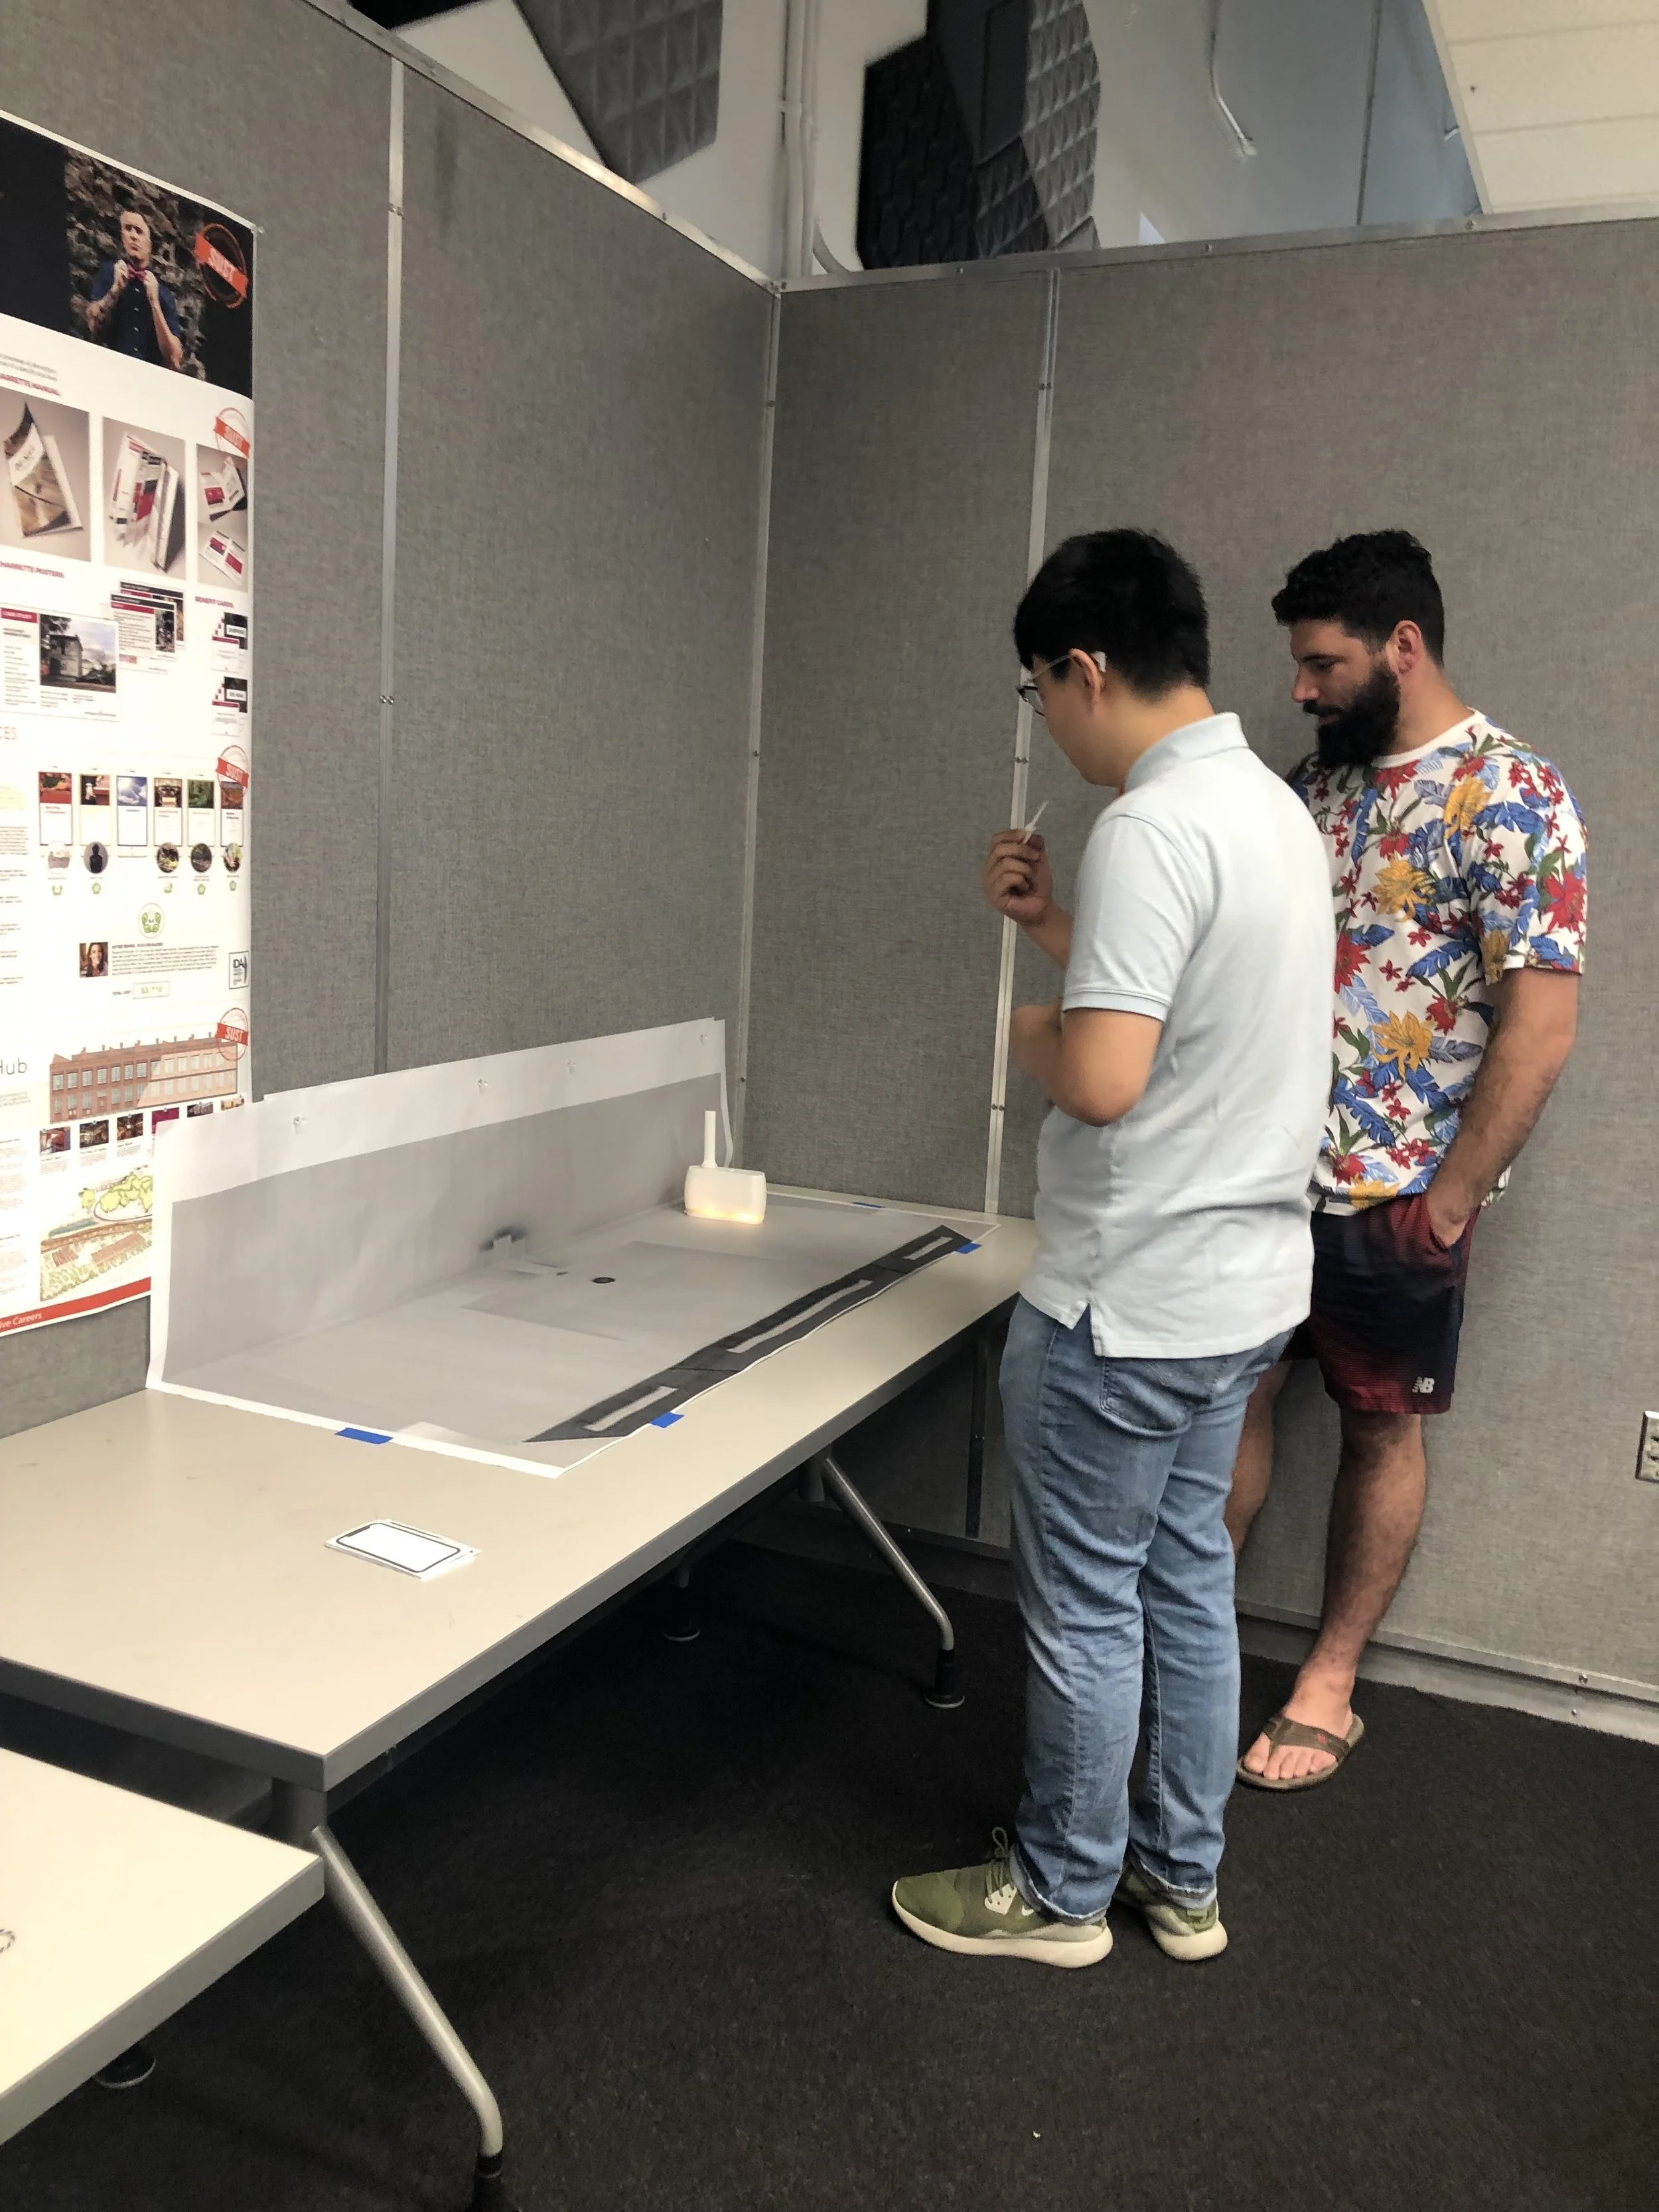
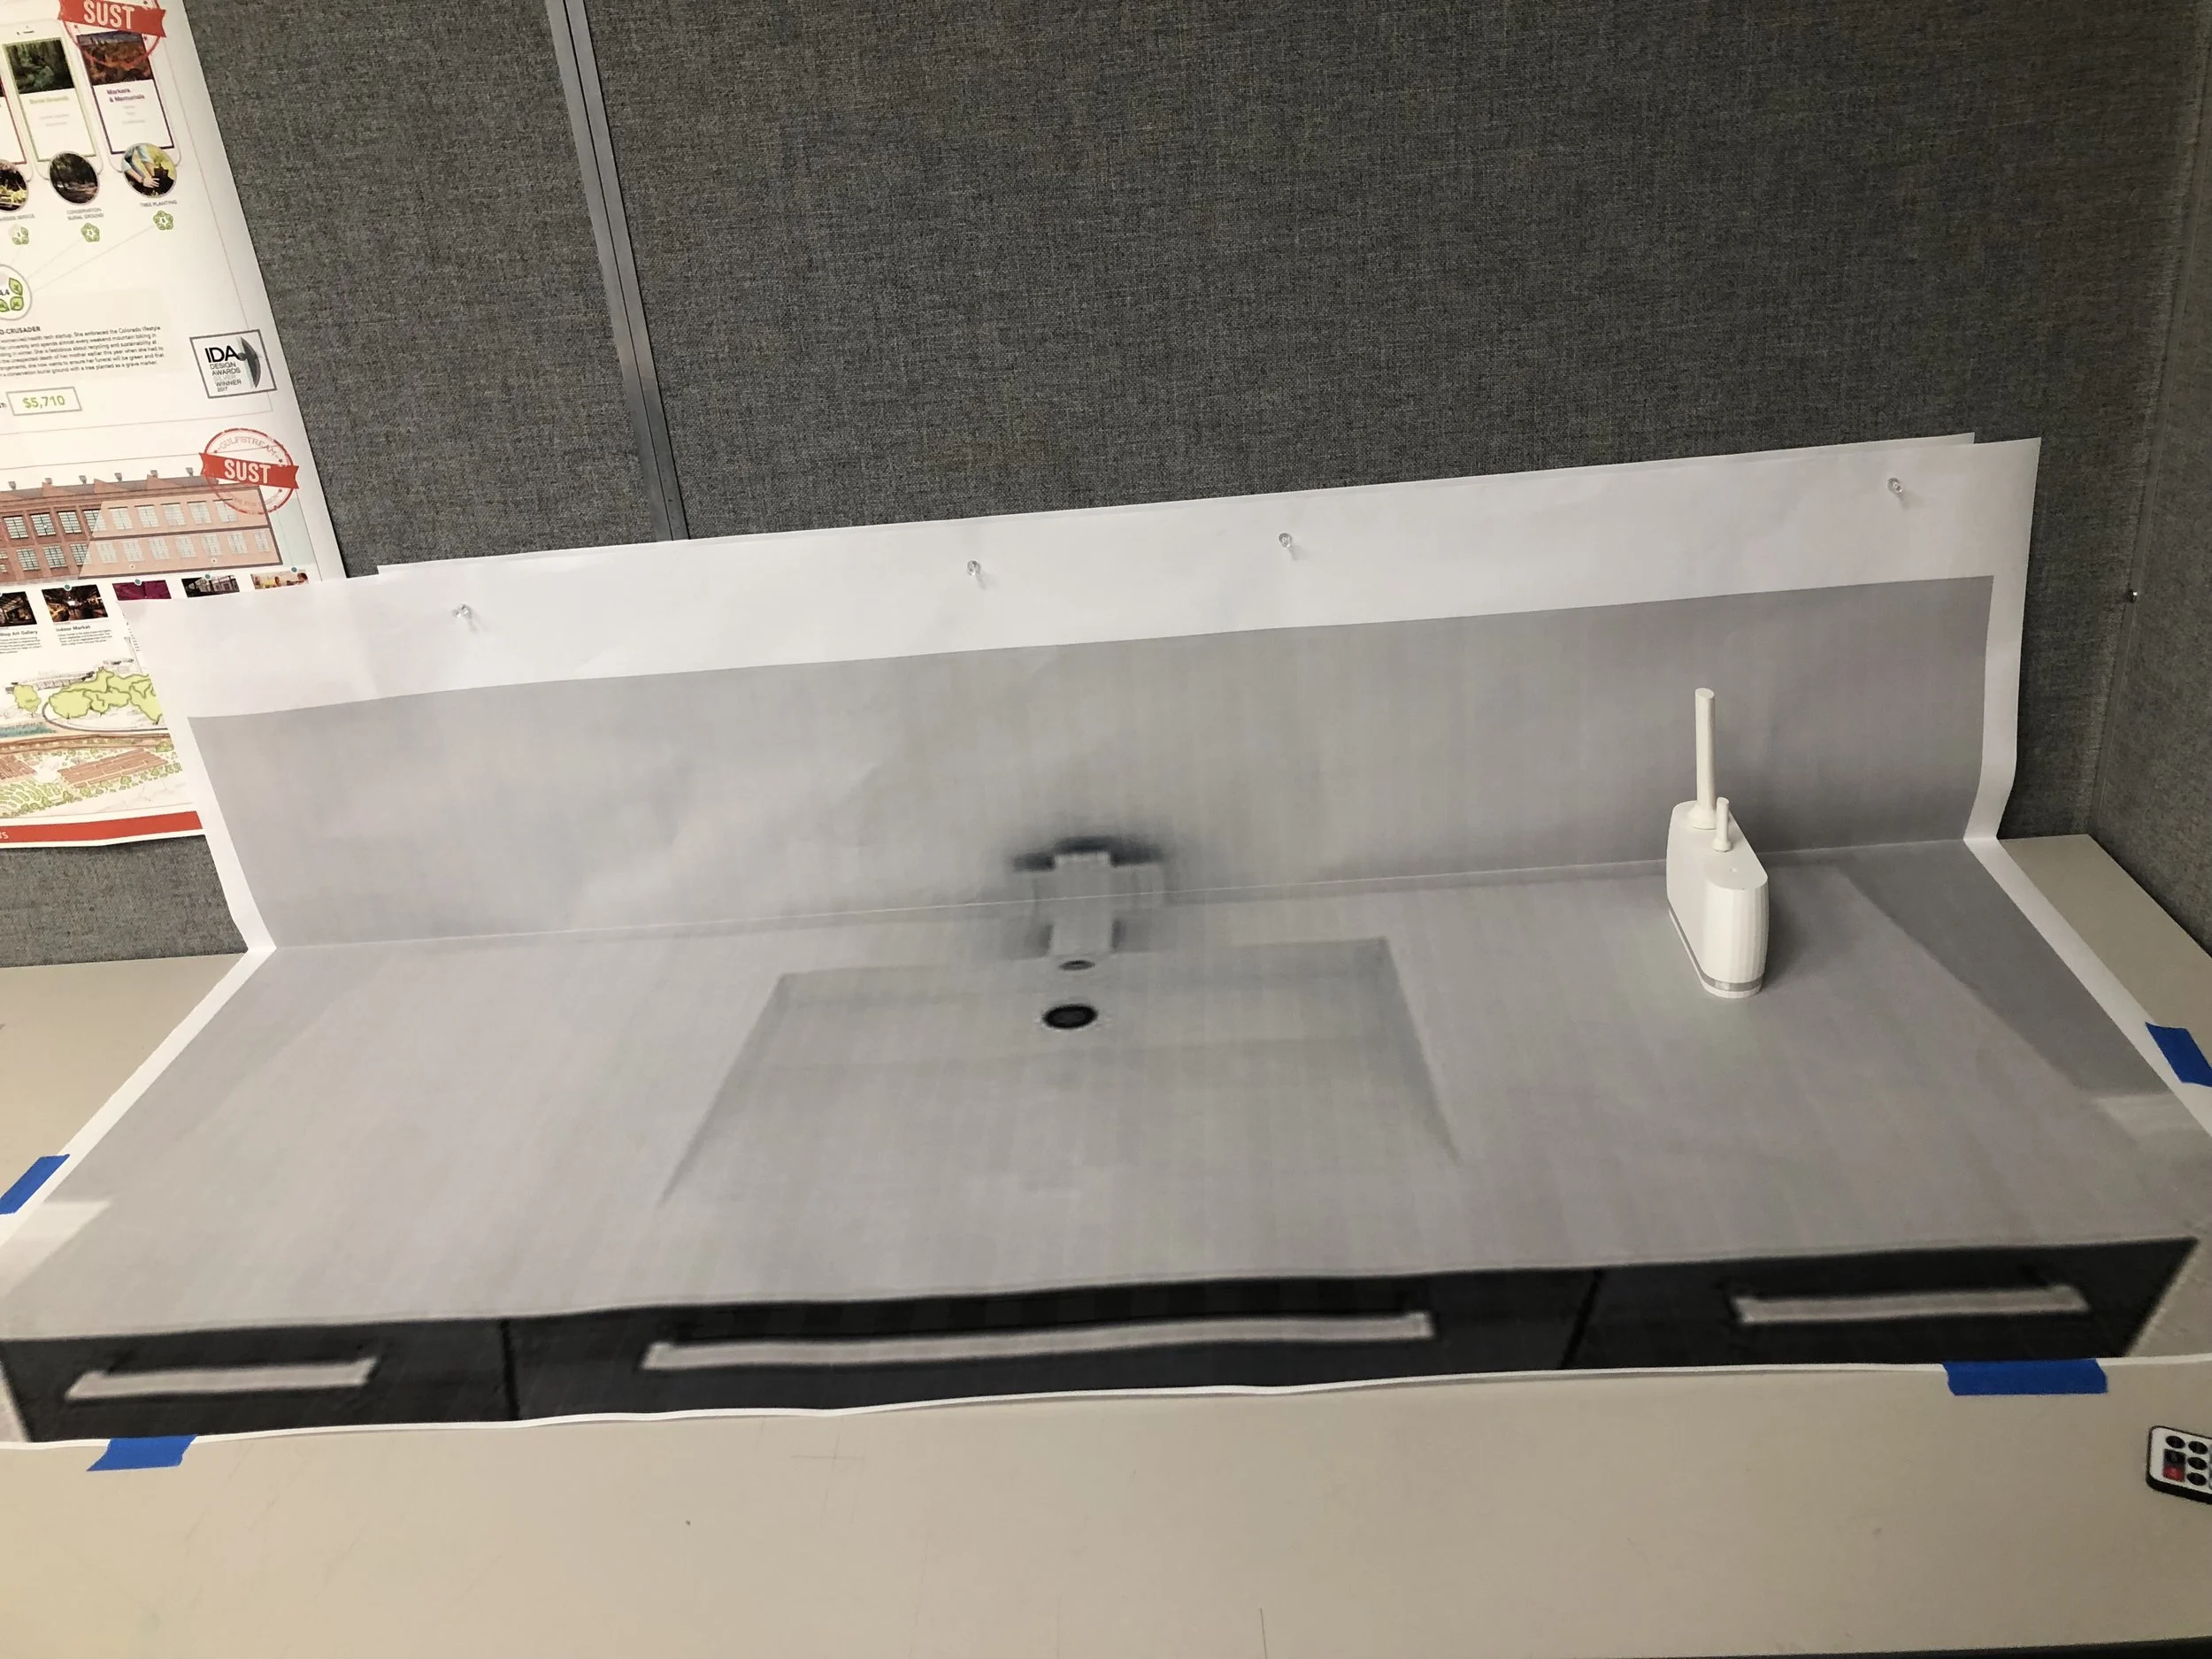
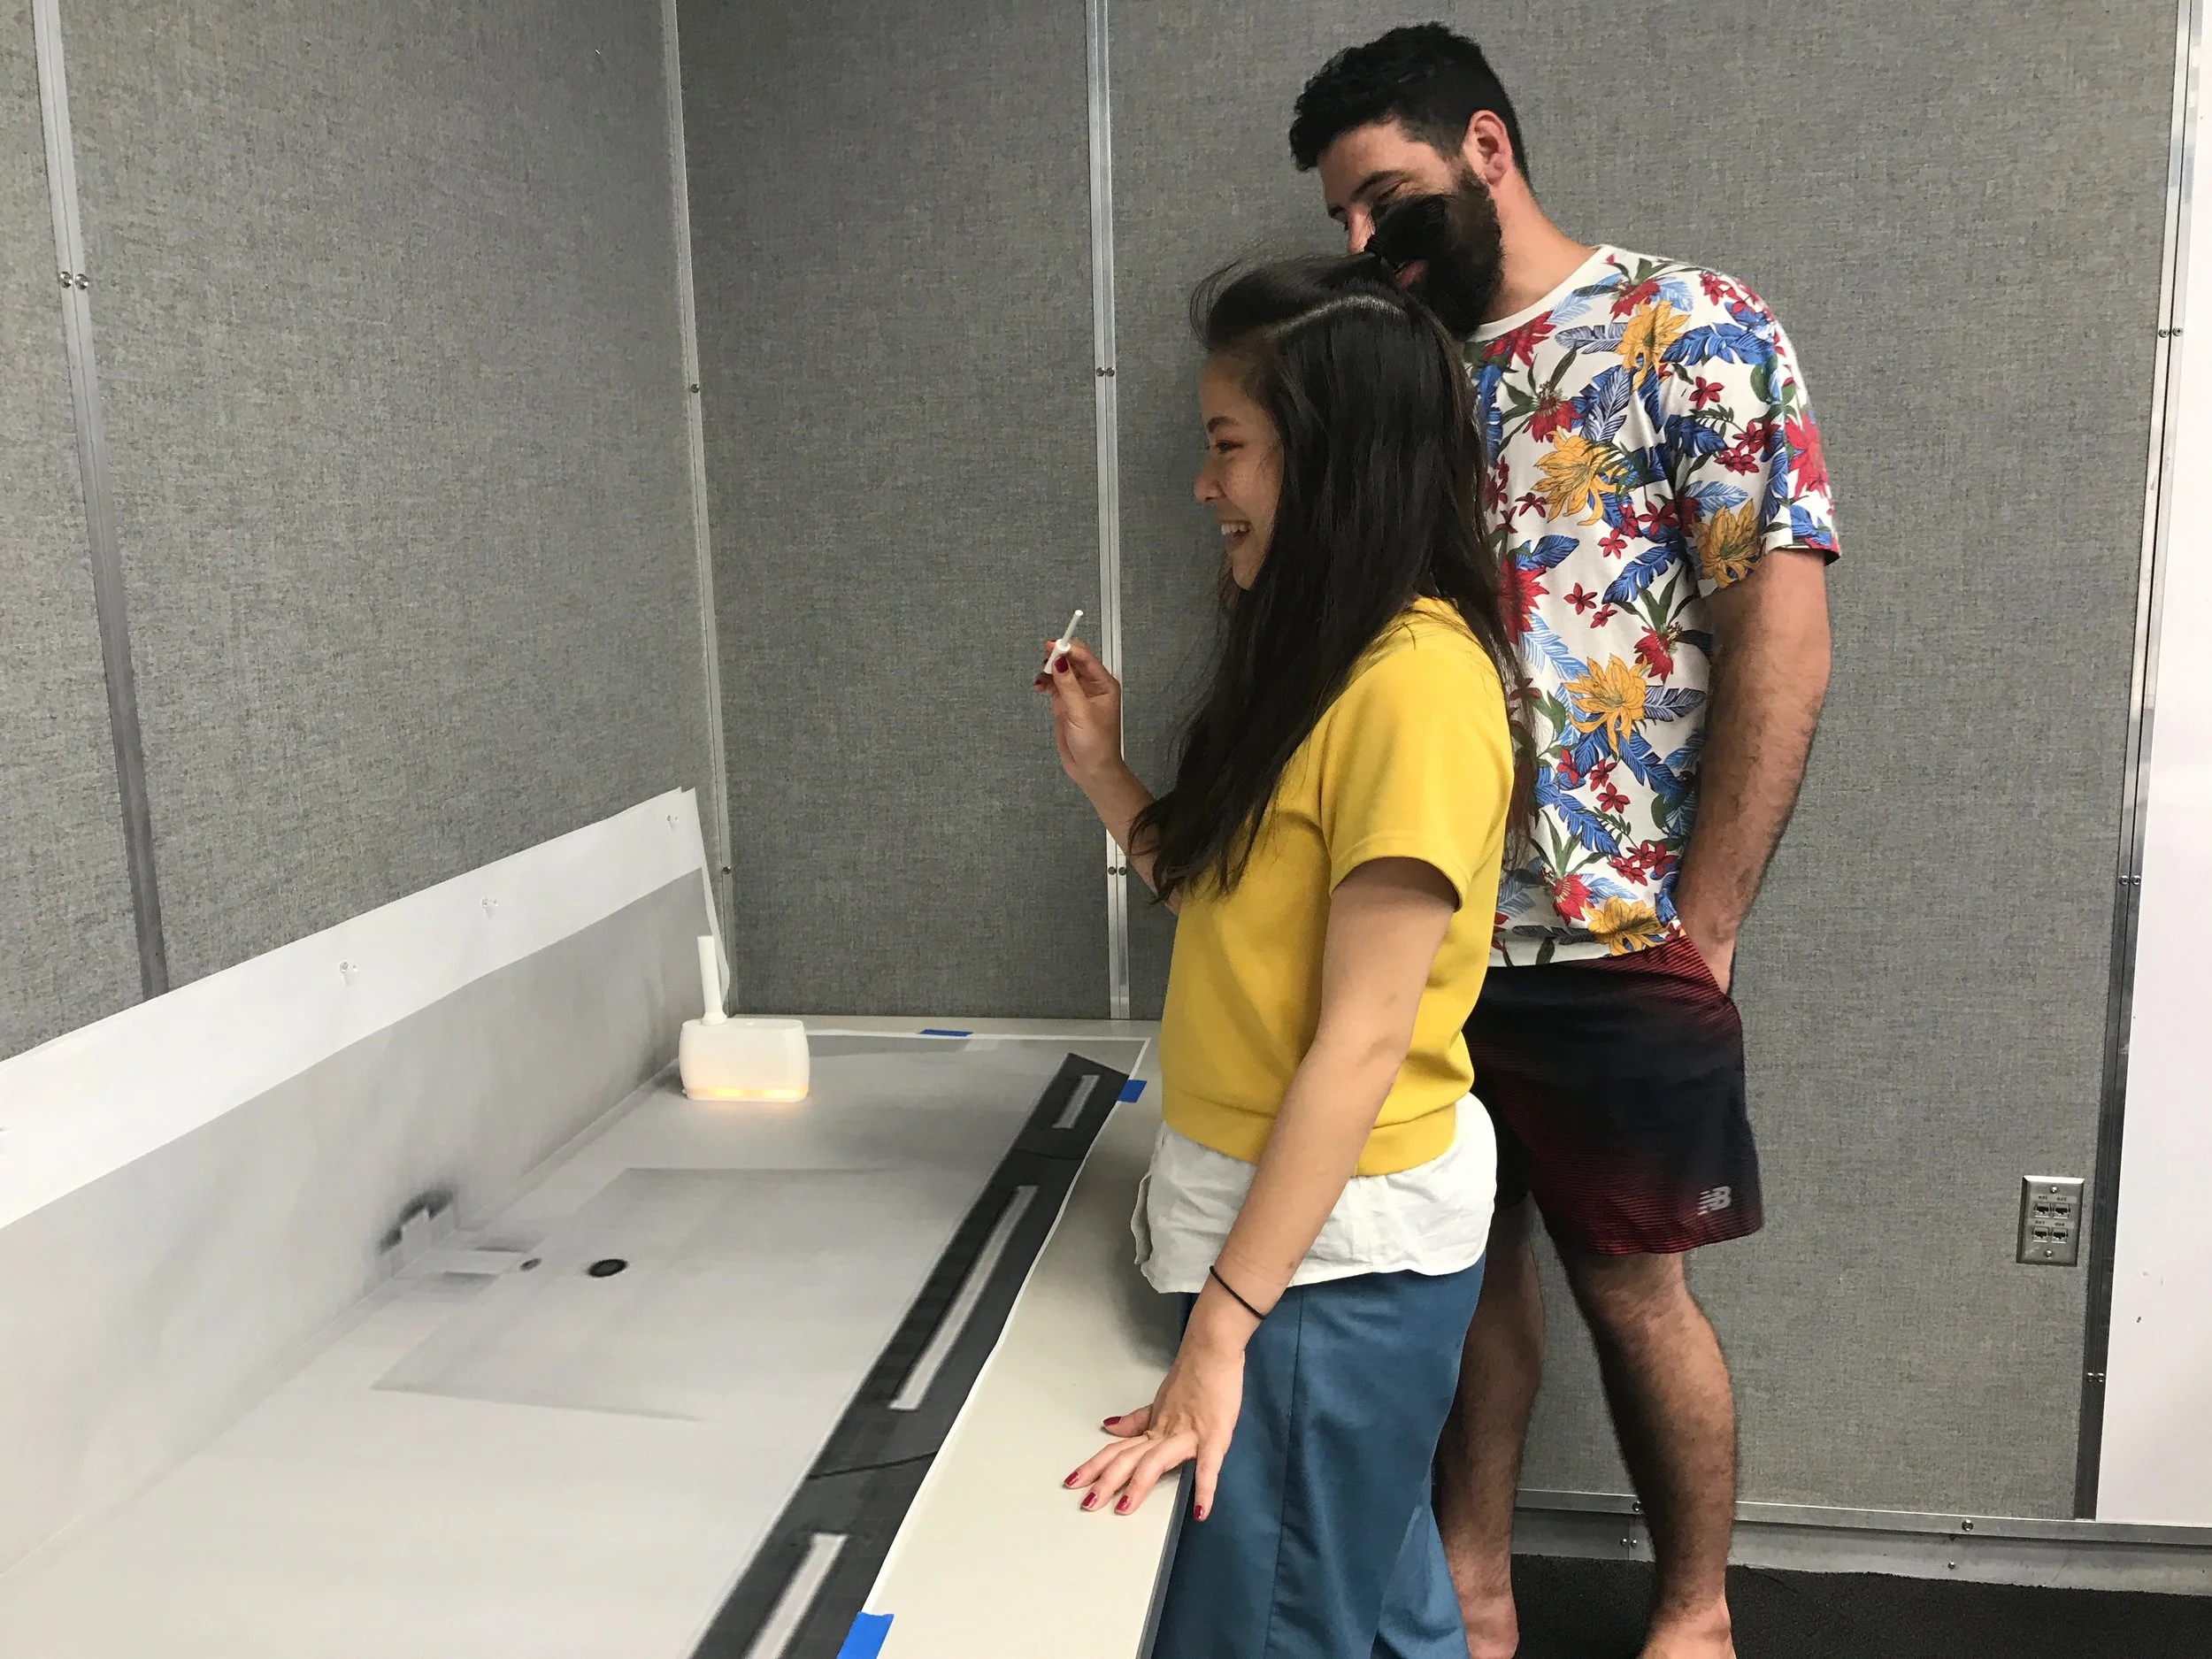
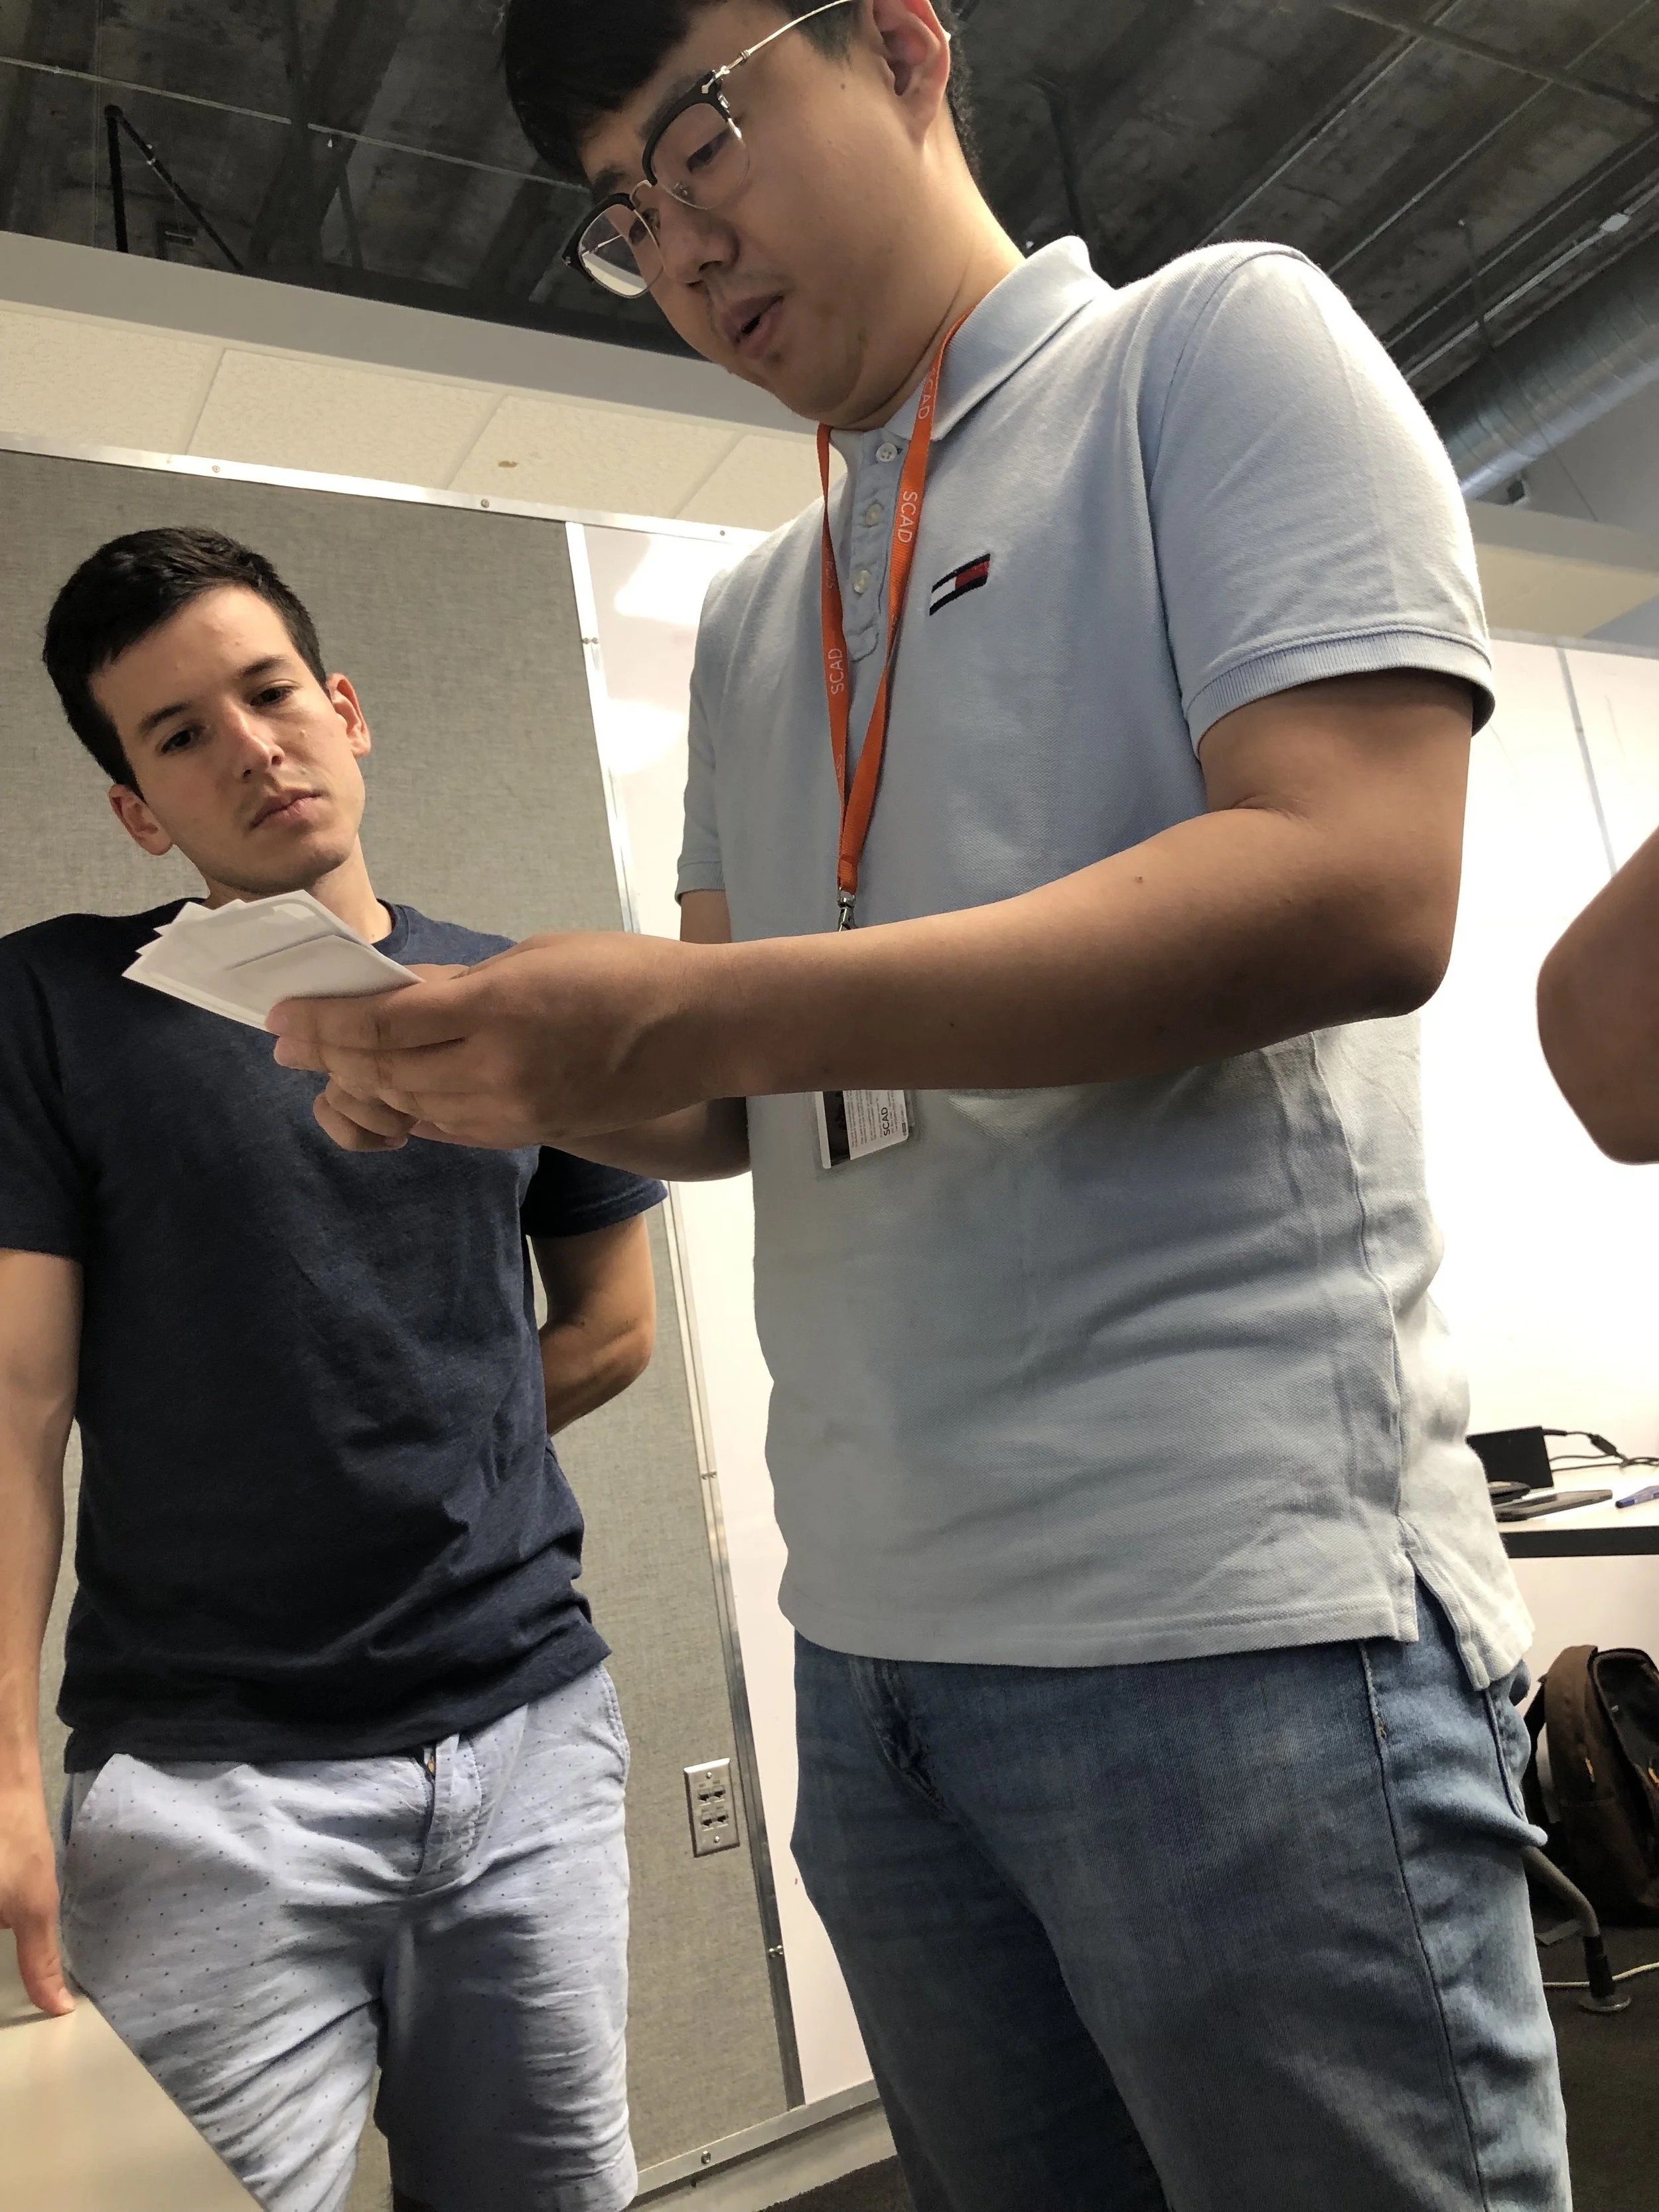
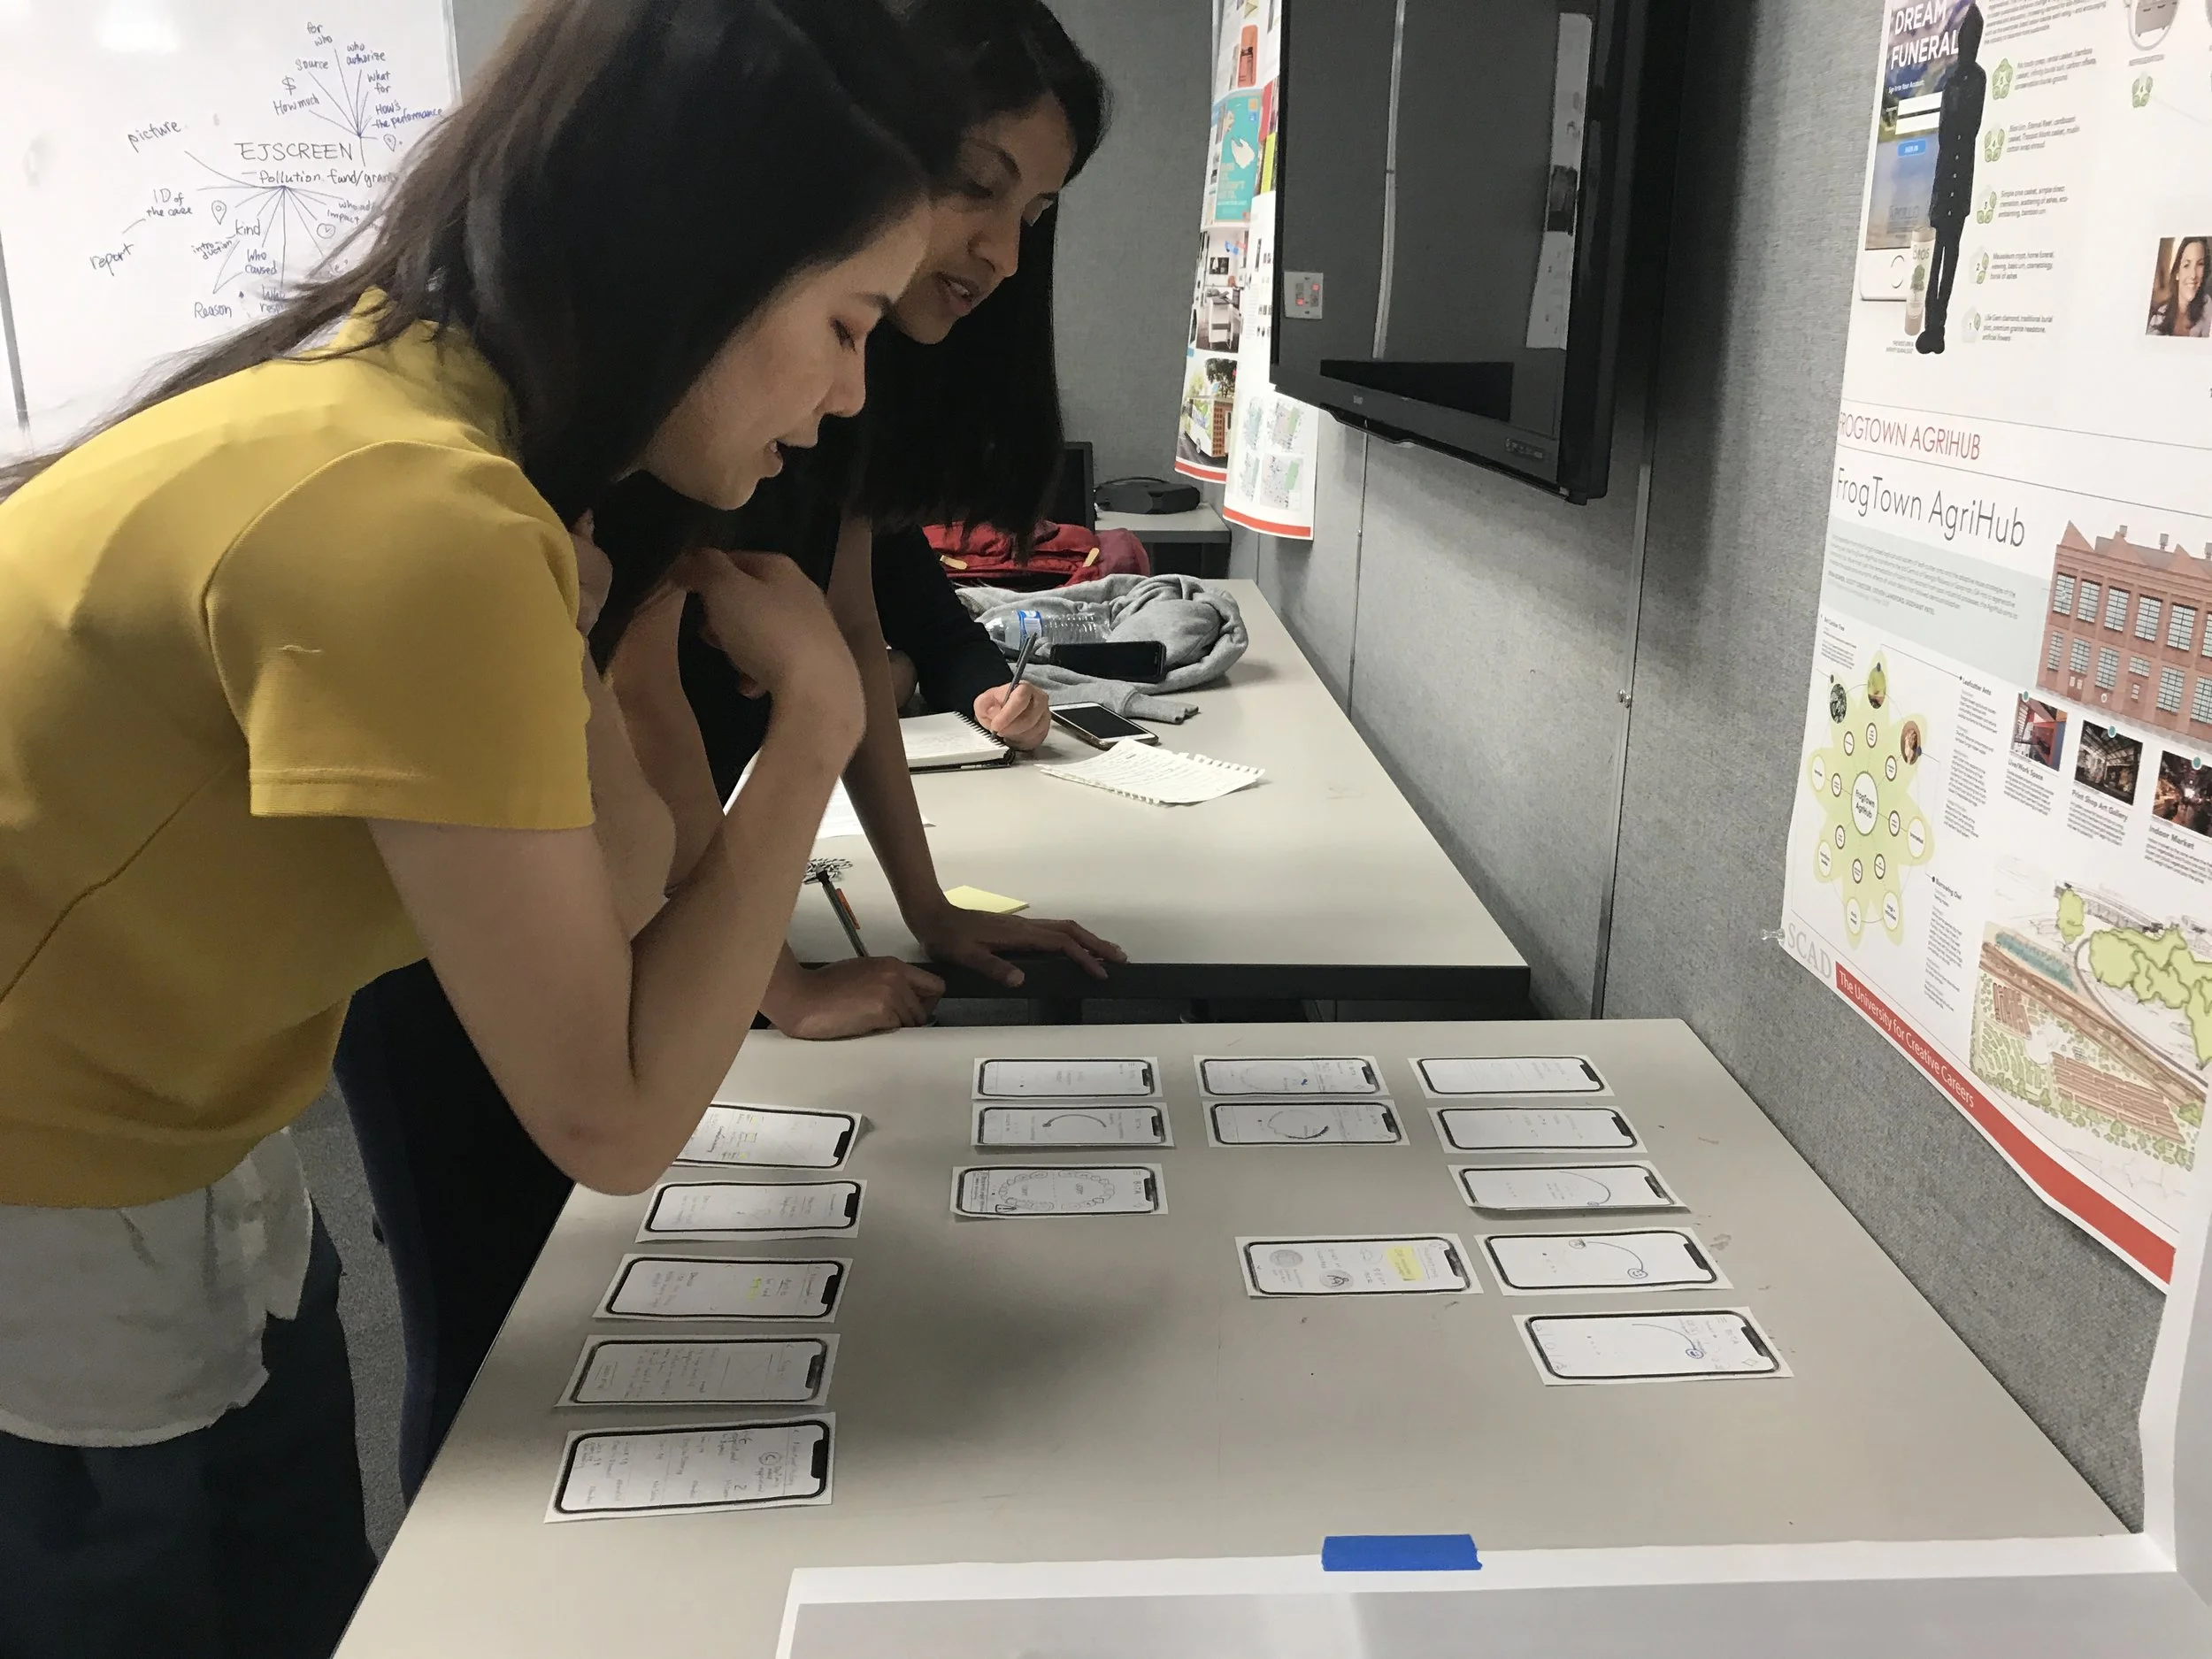
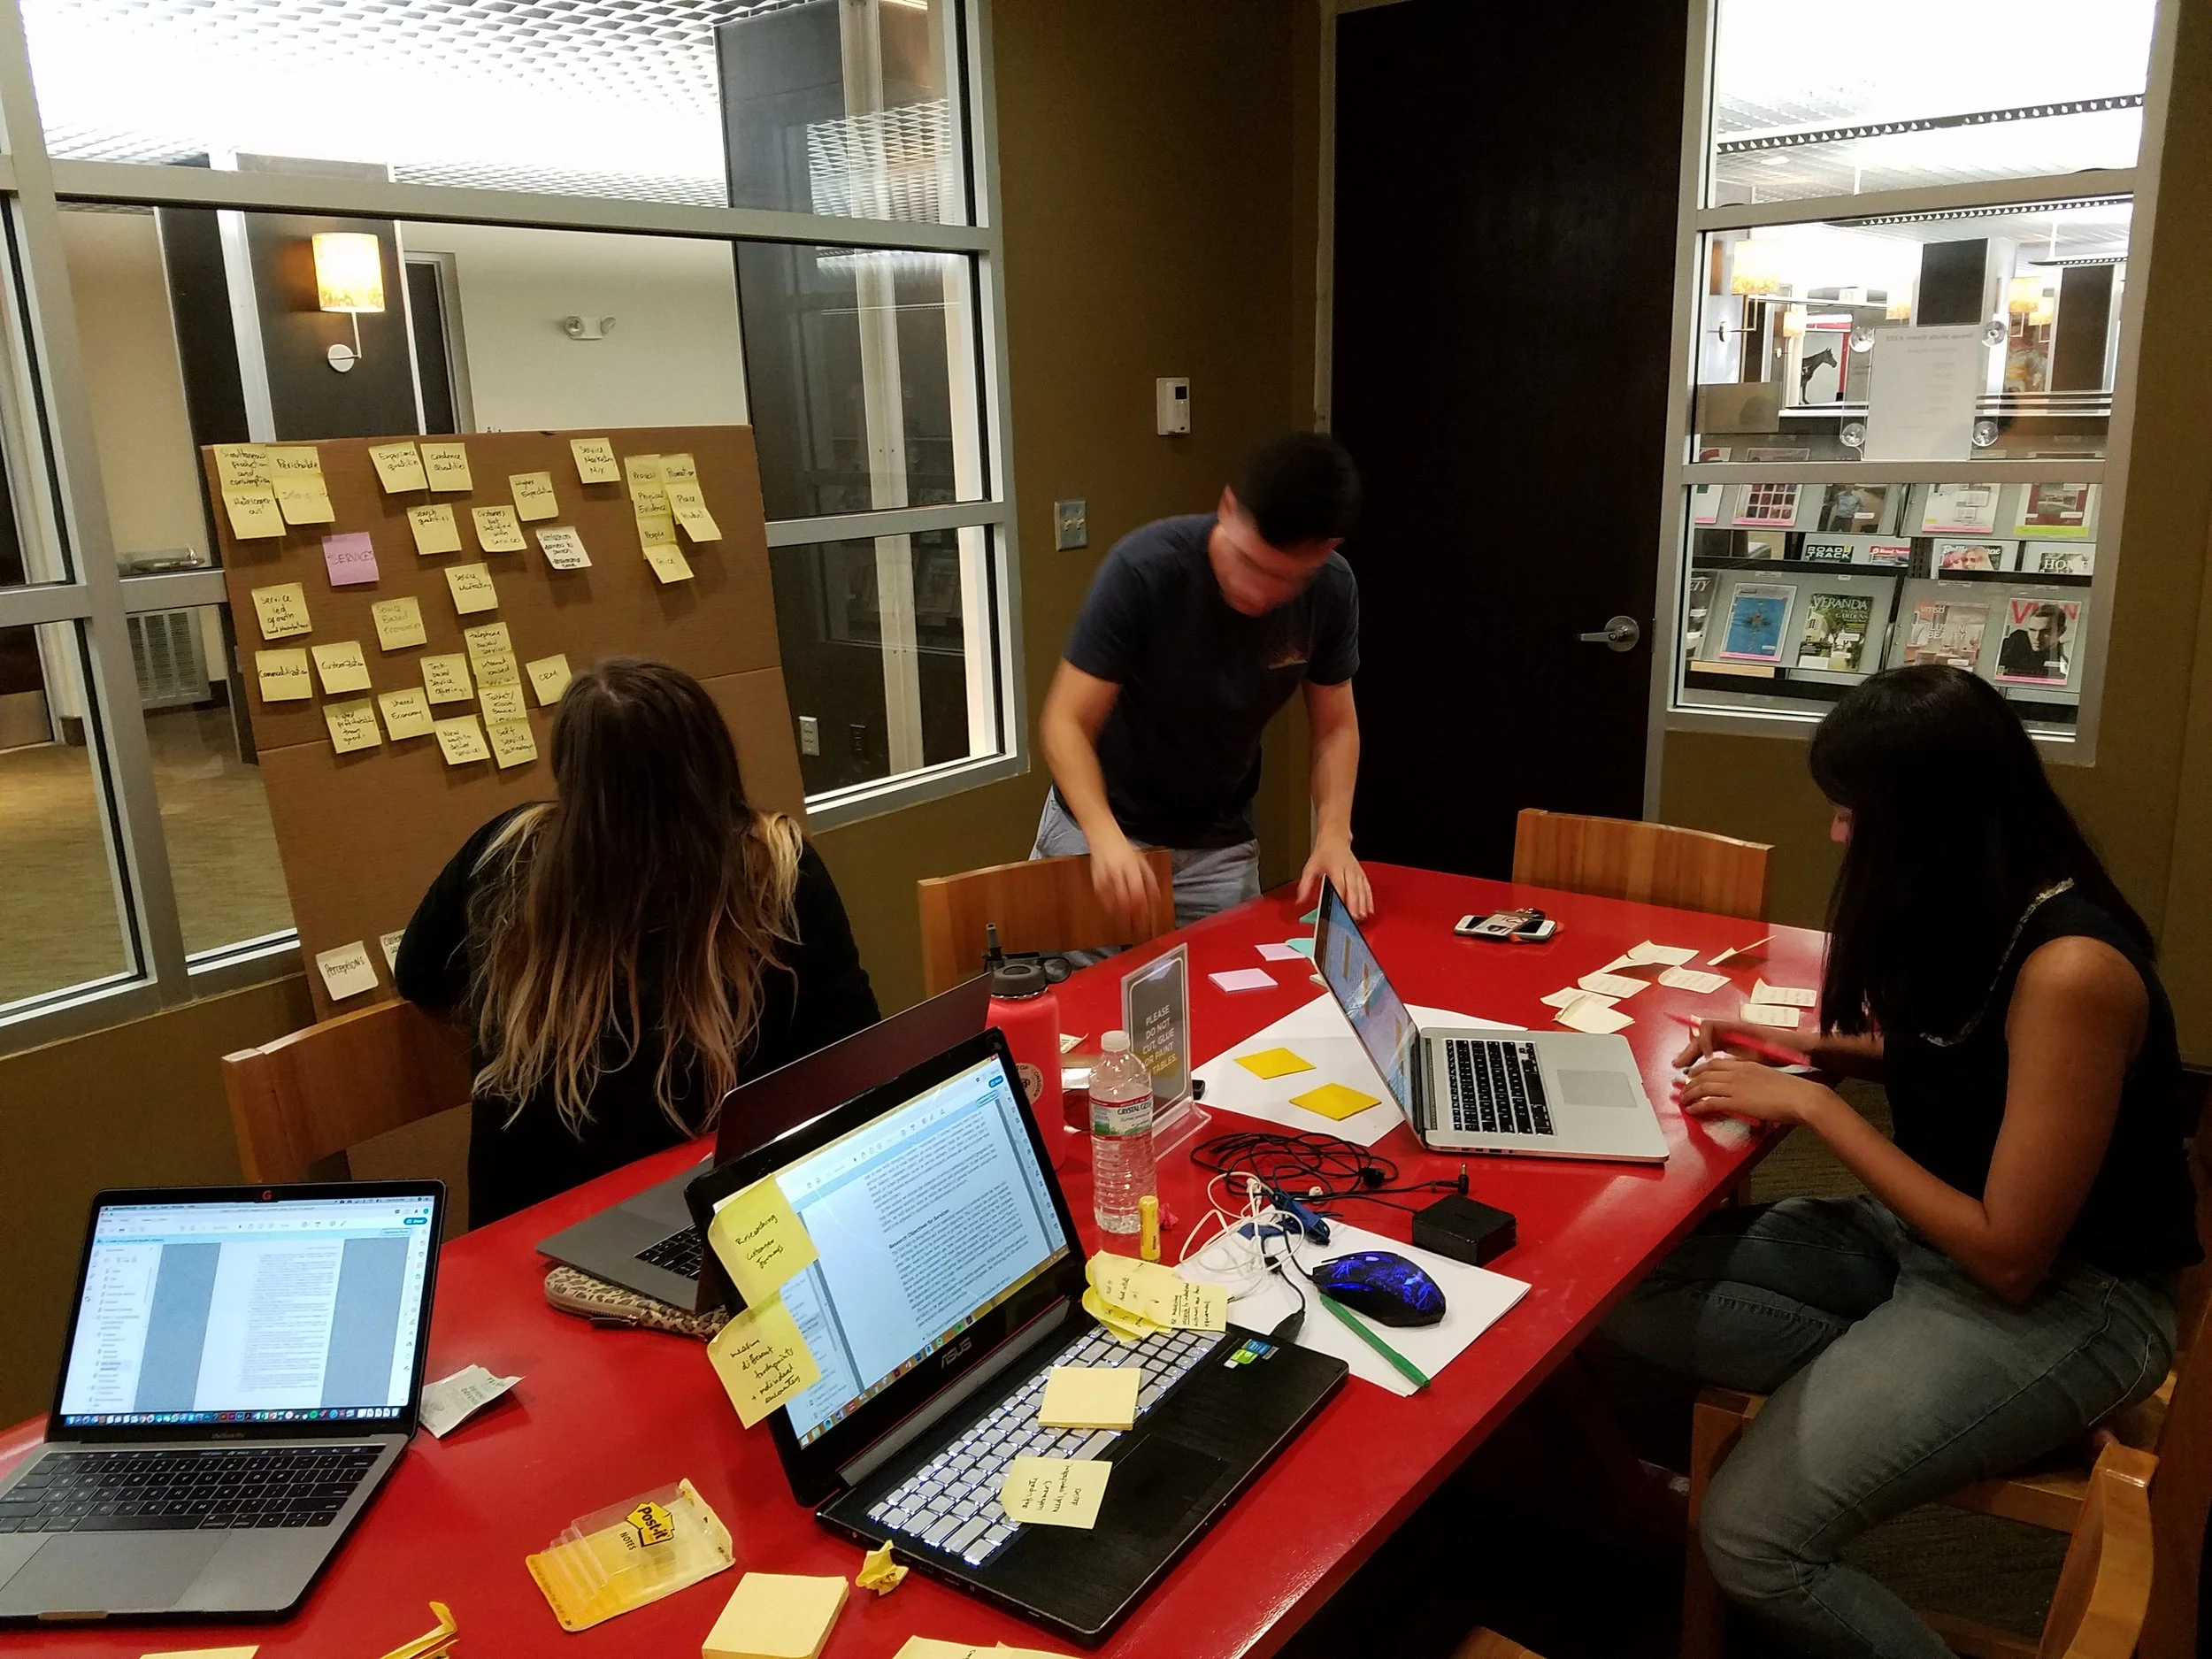 Photos of physical prototype testing on a cardboard countertop mockup, team crit sessions (SCAD lanyards visible), and affinity-diagramming/brainstorming. Good for an optional "how we worked" gallery; no transcribable case-study text.
Flags for the rebuild
- File order doesn't match a clean narrative — reorganized above by topic; treat raw slide order as source material only.
- Two separate rounds of patient/doctor interview findings (slides 002/007 and 003/006) — unclear if different cohorts or an editing artifact; both transcribed in full, developer should decide whether to merge or present as two rounds.
- "Denice" on slide 029 is almost certainly a typo for "Device" — no other reference to a persona/product named Denice exists.
- Real third-party trademarks (Delta Dental, Philips Sonicare) used in mockups and the physical prototype — confirm how to present this in a professional context (e.g. "for illustrative/prototype purposes").
- This was a SCAD academic project — multiple photos show SCAD lanyards and a classroom crit setting; worth stating explicitly in the intro for context.
- Slide 021's metrics are very likely projected/simulated, not real deployment data (dated "2020 vs 2019" for what was still an early physical prototype per the process photos) — frame as "projected outcomes," not real-world results, unless the user confirms otherwise.
- Slide 032 (closing photo of a woman at a mirror) reads as stock photography, not original project documentation — confirm licensing before reuse.
- Minor illegible spots: slide 028's whiteboard photo has some glare-affected handwriting; slide 009's word cloud is dense and may not be 100% complete.
Additional process photos