CALI
Competitive Agent Longitudinal Intelligence
Source: live page text at /cali/ (real HTML text, not a slide deck).
Title & subtitle
Case Study: CALI — Competitive Agent Longitudinal Intelligence "Designed and led CALI, a longitudinal competitive intelligence system that tracks how customers actually experience, trust, and adopt AI shopping agents enabling faster, lower‑risk product decisions grounded in live market behavior."
Context & Problem
The Challenge: AI shopping agents evolving rapidly across competitors; traditional research methods too slow and fragmented; leadership lacked continuous benchmarks for value, trust, adoption. Why It Mattered: High uncertainty in a visible product space; late validation increased risk and rework; decisions relied on assumptions and anecdotes.
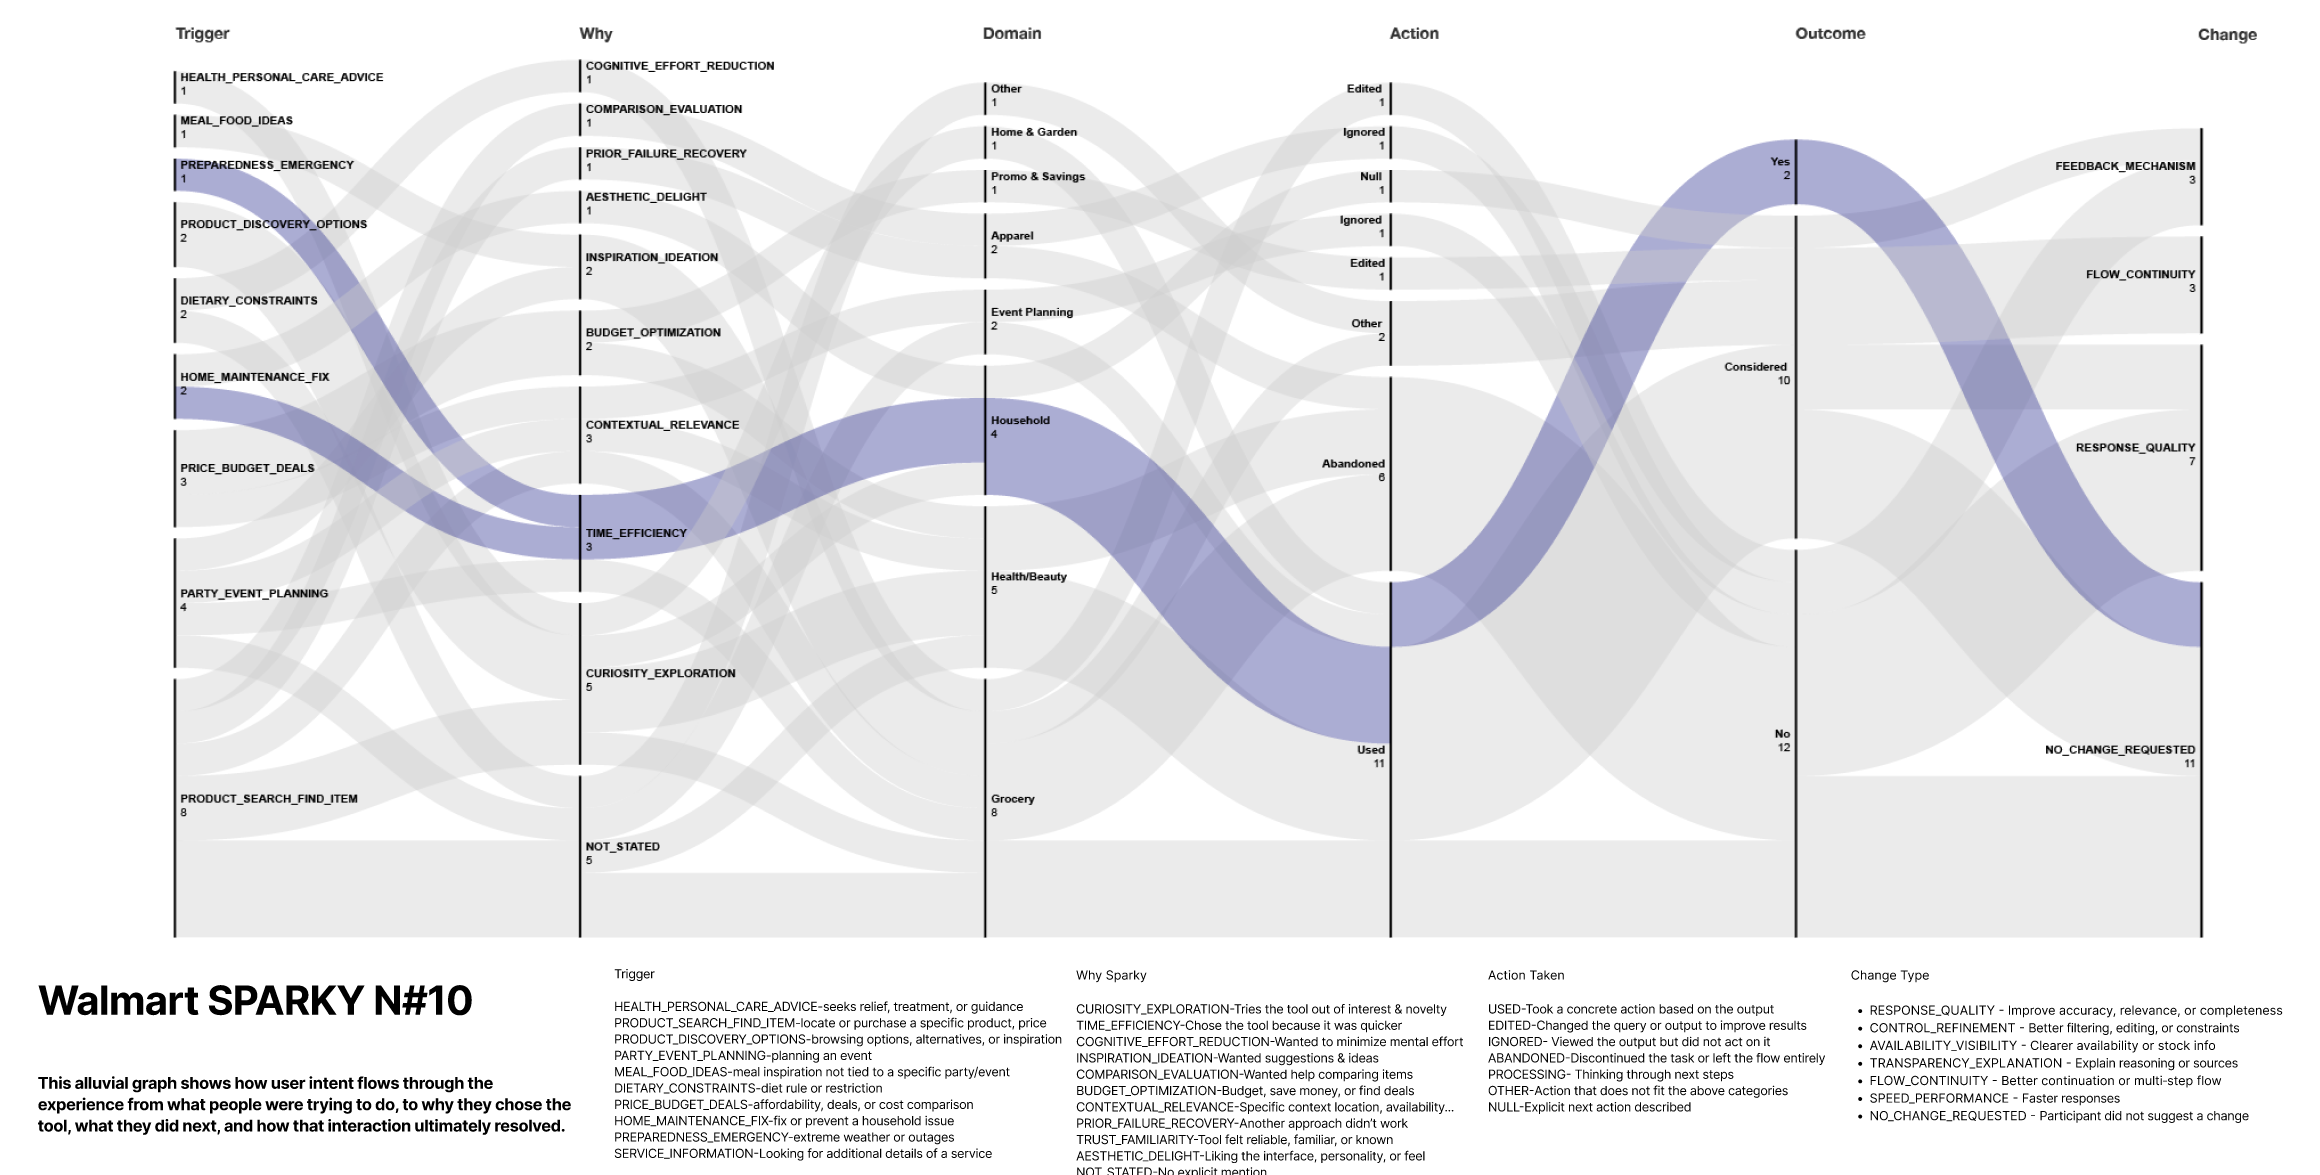
[Image: dashboard/analytics screenshot showing competitive metrics]
Role: Principal researcher and methodology architect. Defined measurement framework, sampling strategy, reporting cadence. Partnered across product, design, and leadership. Scope: Competitive intelligence, longitudinal behavioral research, trust/adoption/AI-human interaction measurement.
The Solution: What CALI Is
CALI collects structured qualitative signals weekly with stable coding, producing monthly pulses and quarterly syntheses with forecasts.
How It Works
Sampling: Flexible design with fresh or longitudinal participants; 2.25M+ recruitable pool. Data Collection: Participants reference actual chat history from their last three AI agent interactions (competitors included). Measurement: Structured battery assessing behavior, experience, trust, adoption. Synthesis: Monthly memos with centralized archive.
Core Framework
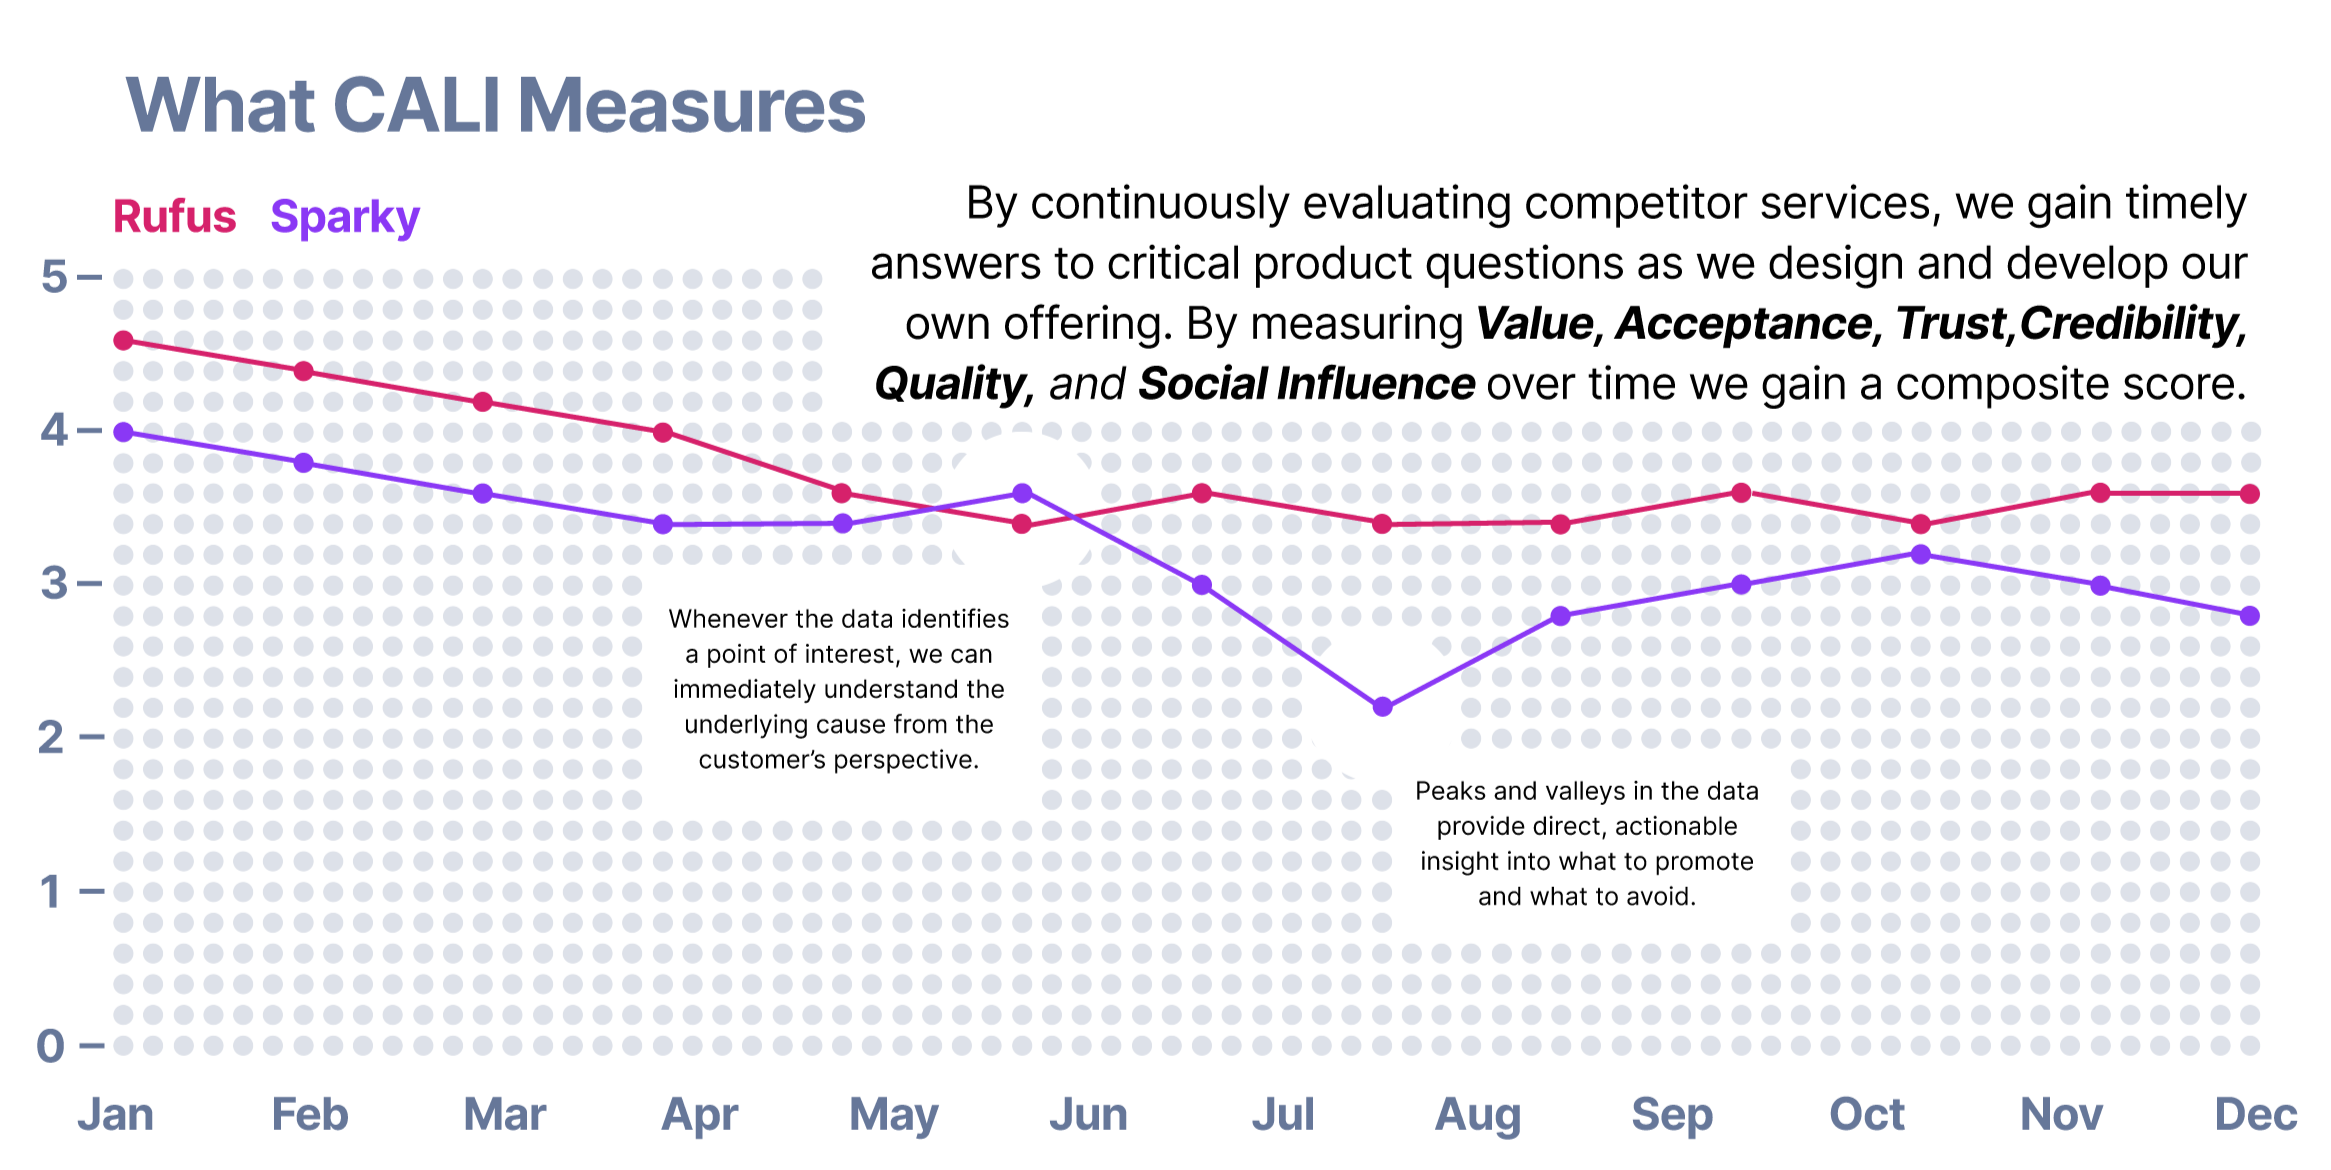
Dimensions Measured: App value; Acceptance/reuse intent; Trusting stance; Information credibility; System quality; Social influence; Organizational assurance; Optional: privacy, control, editability. Composite Score: Unweighted mean enabling "clear, high‑level comparison across agents."
[Image: measurement framework visualization]

Output Cadence & Cost
Monthly pulse + quarterly synthesis. Baseline: 15 participants/month across 3 services = ~$20k/year (~3% of CX budget). Scalable to biweekly or weekly.
[Image: cost/resourcing chart]
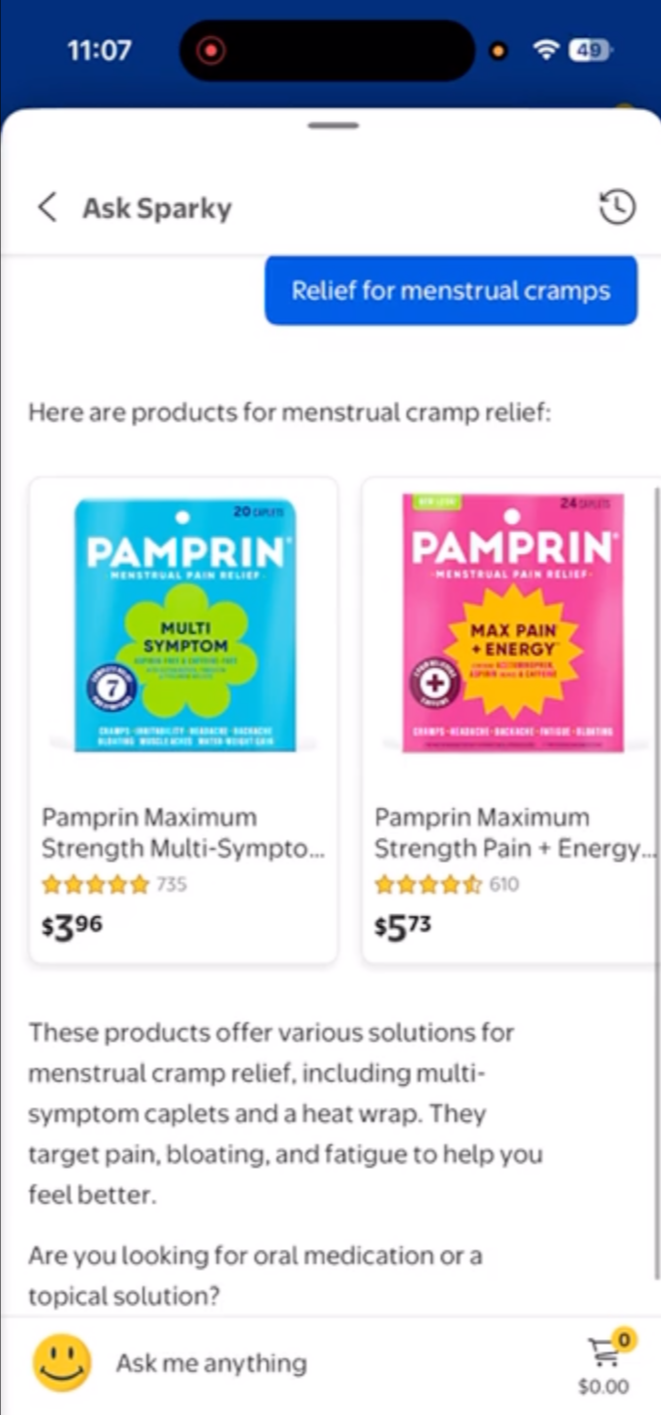
Impact & Value
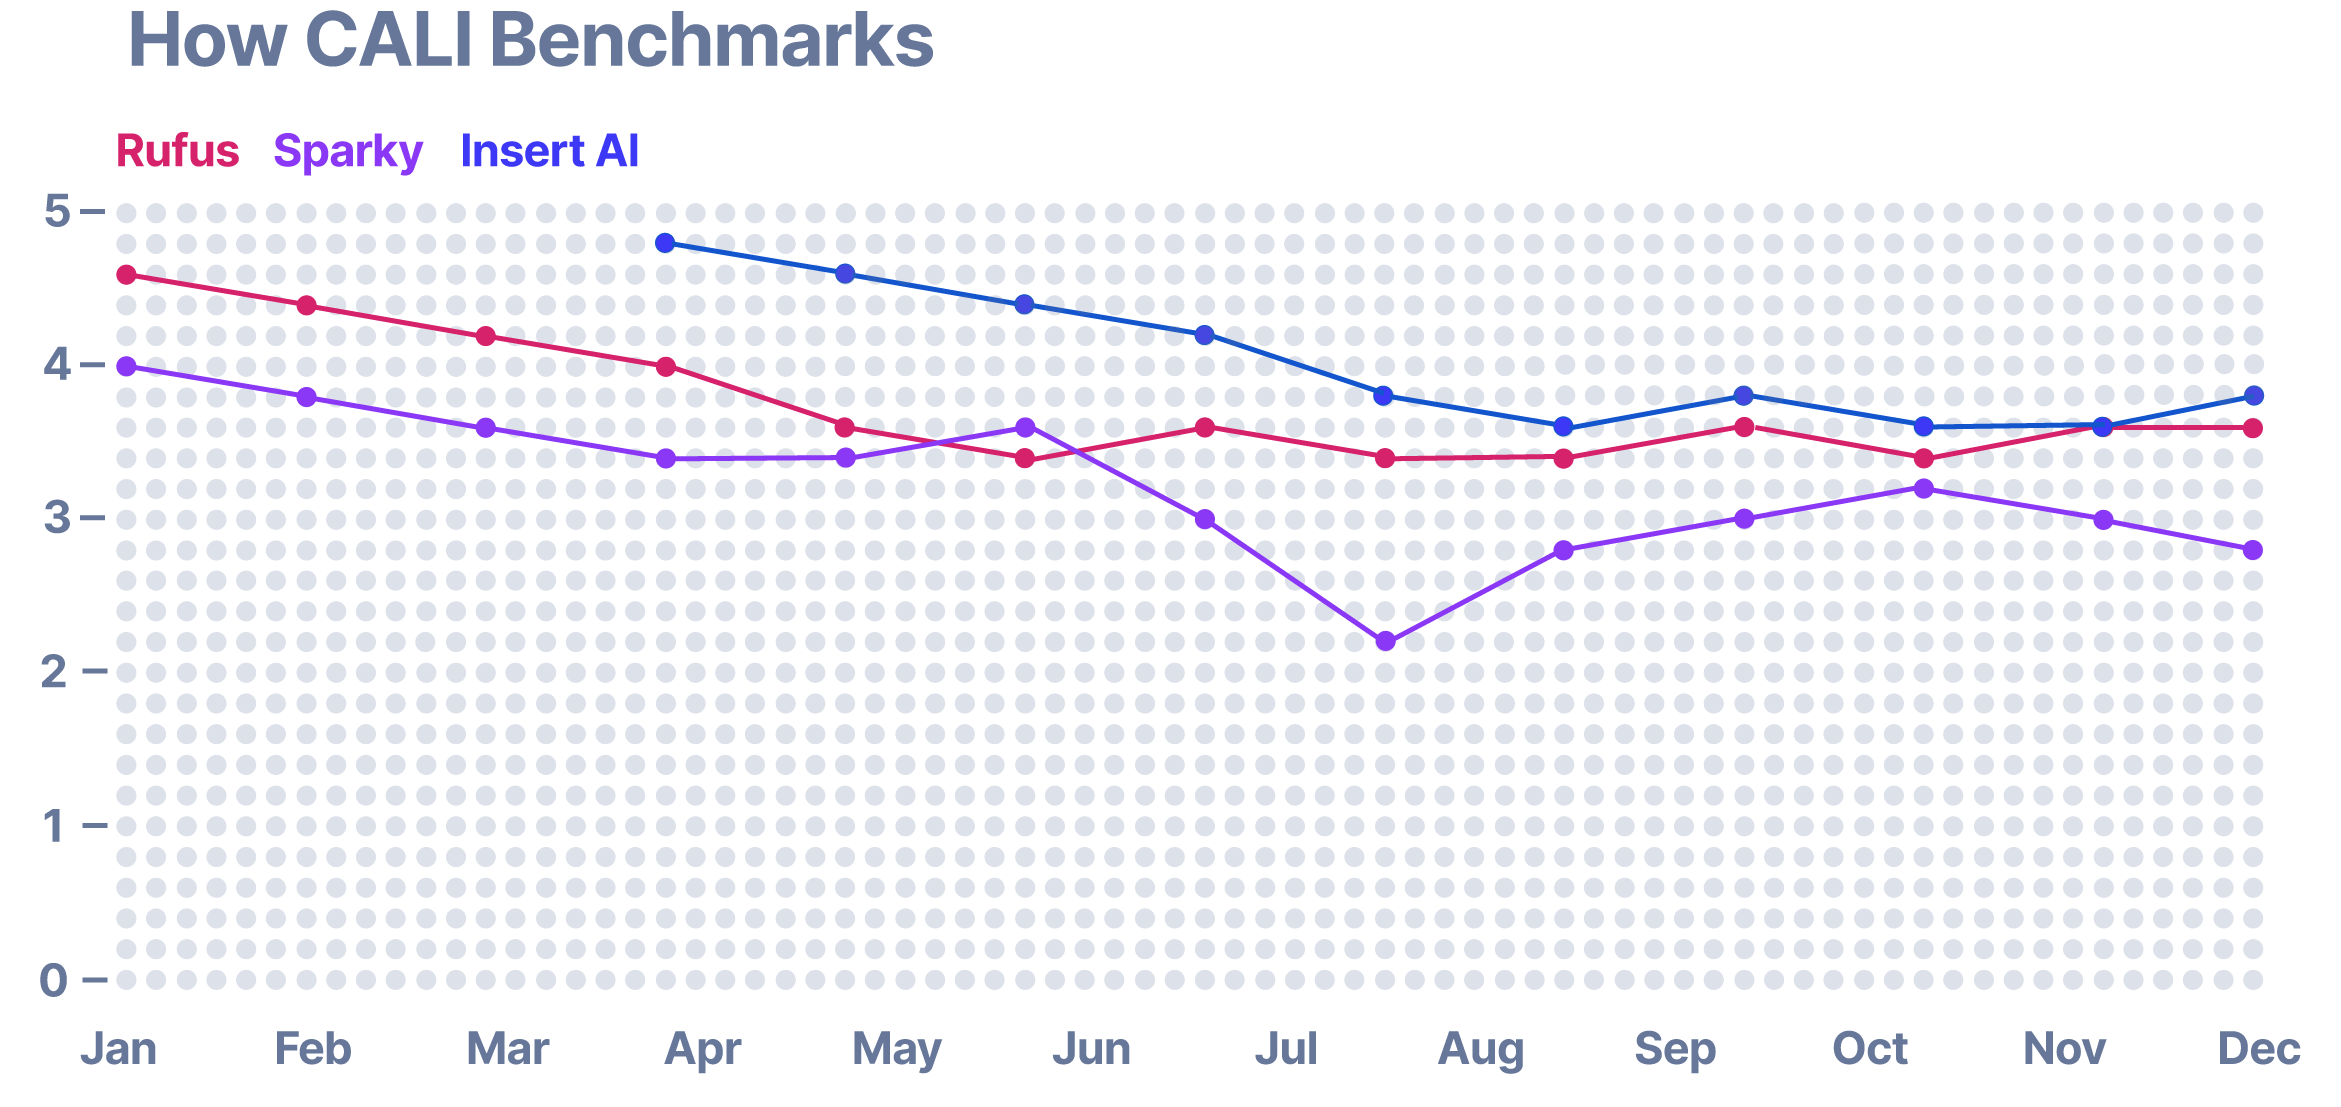
Enables: Immediate diagnosis of performance peaks/valleys; early risk detection; reduced assumption reliance. Over Time: Creates a living competitive benchmark; identifies differentiation, parity, risk areas; drives faster, confident decisions.
[Image: impact/results visualization]
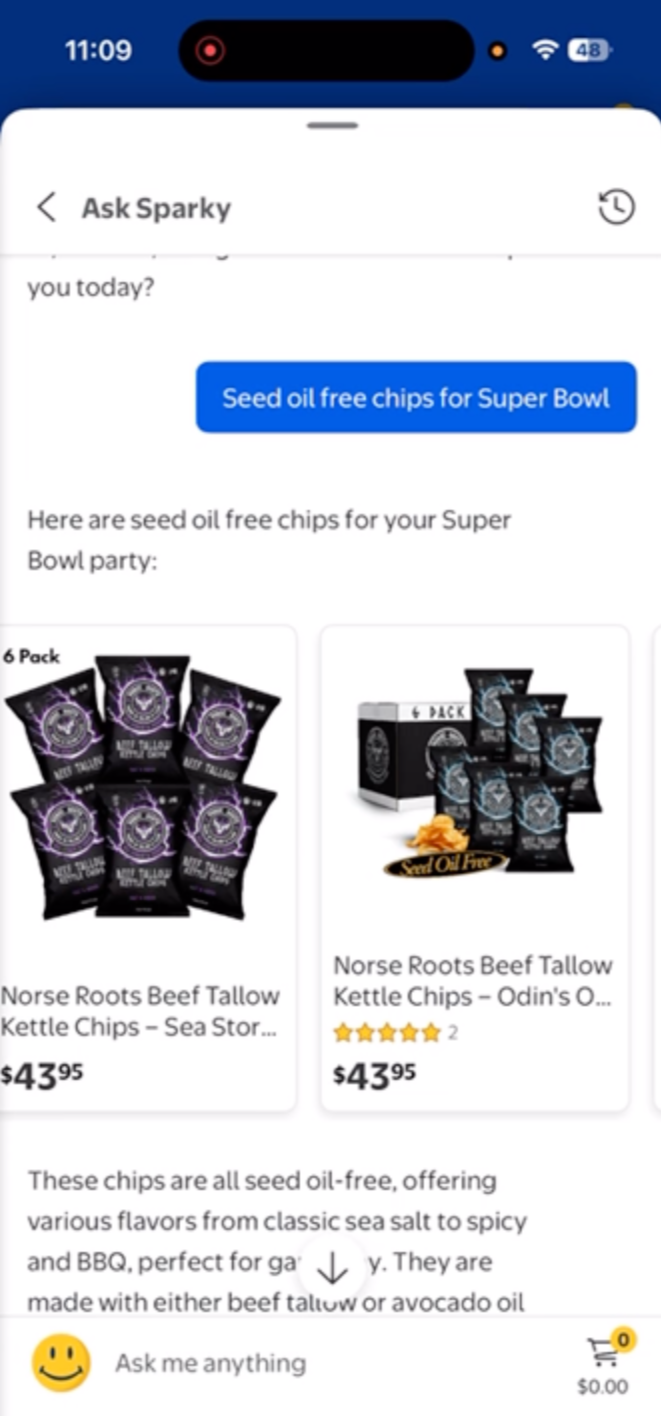
Bottom Line: "Replaced episodic research with continuous competitive intelligence—grounded in real customer behavior."
Additional photos