Embracing Complexity
Mapping and modernizing USDA NASS's survey operations
Source: live page text at /new-page-3/ (was password-protected, unlocked by user). Work for Steampunk.
Opening
"USDA NASS hired Steampunk to understand the end-to-end flow of their survey creation, distribution, data collection, and dissemination processes." A team was assembled to research the USDA NASS organization across 12 siloed departments, beginning with secondary research followed by 28 semi-structured interviews with key participants.
[Image: USDA logo, near opening paragraph]
1. Systems Identification
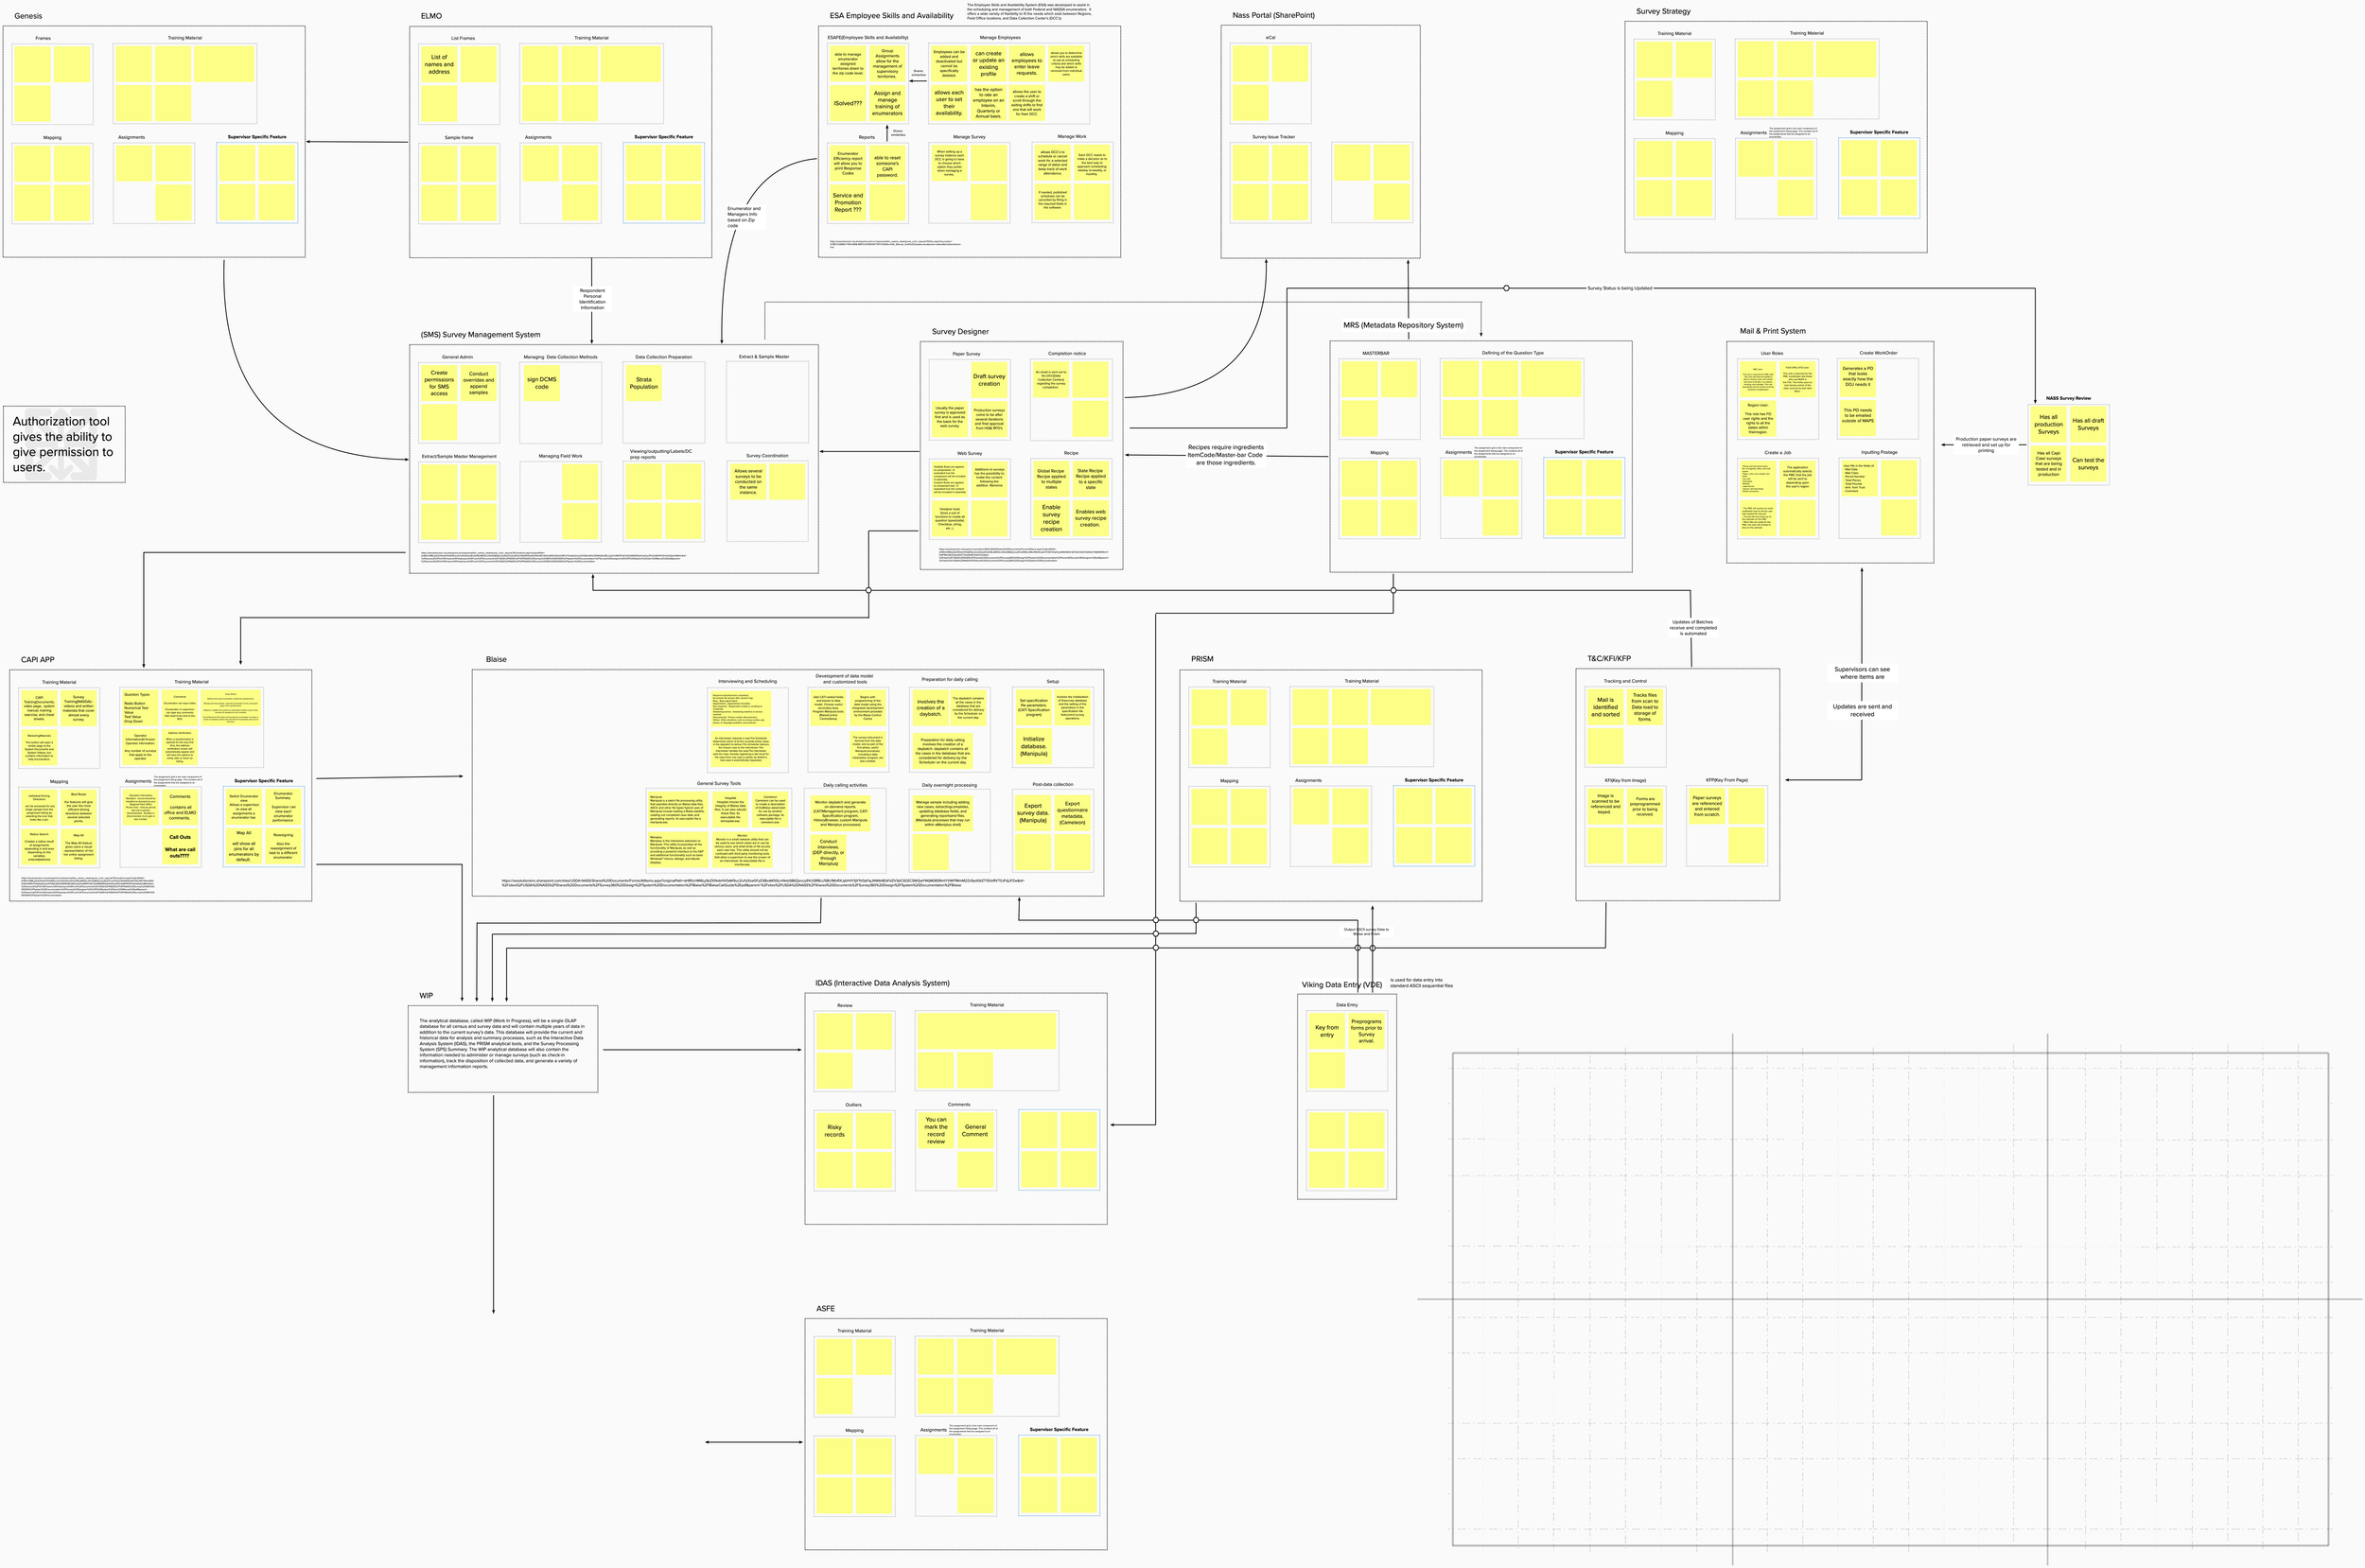
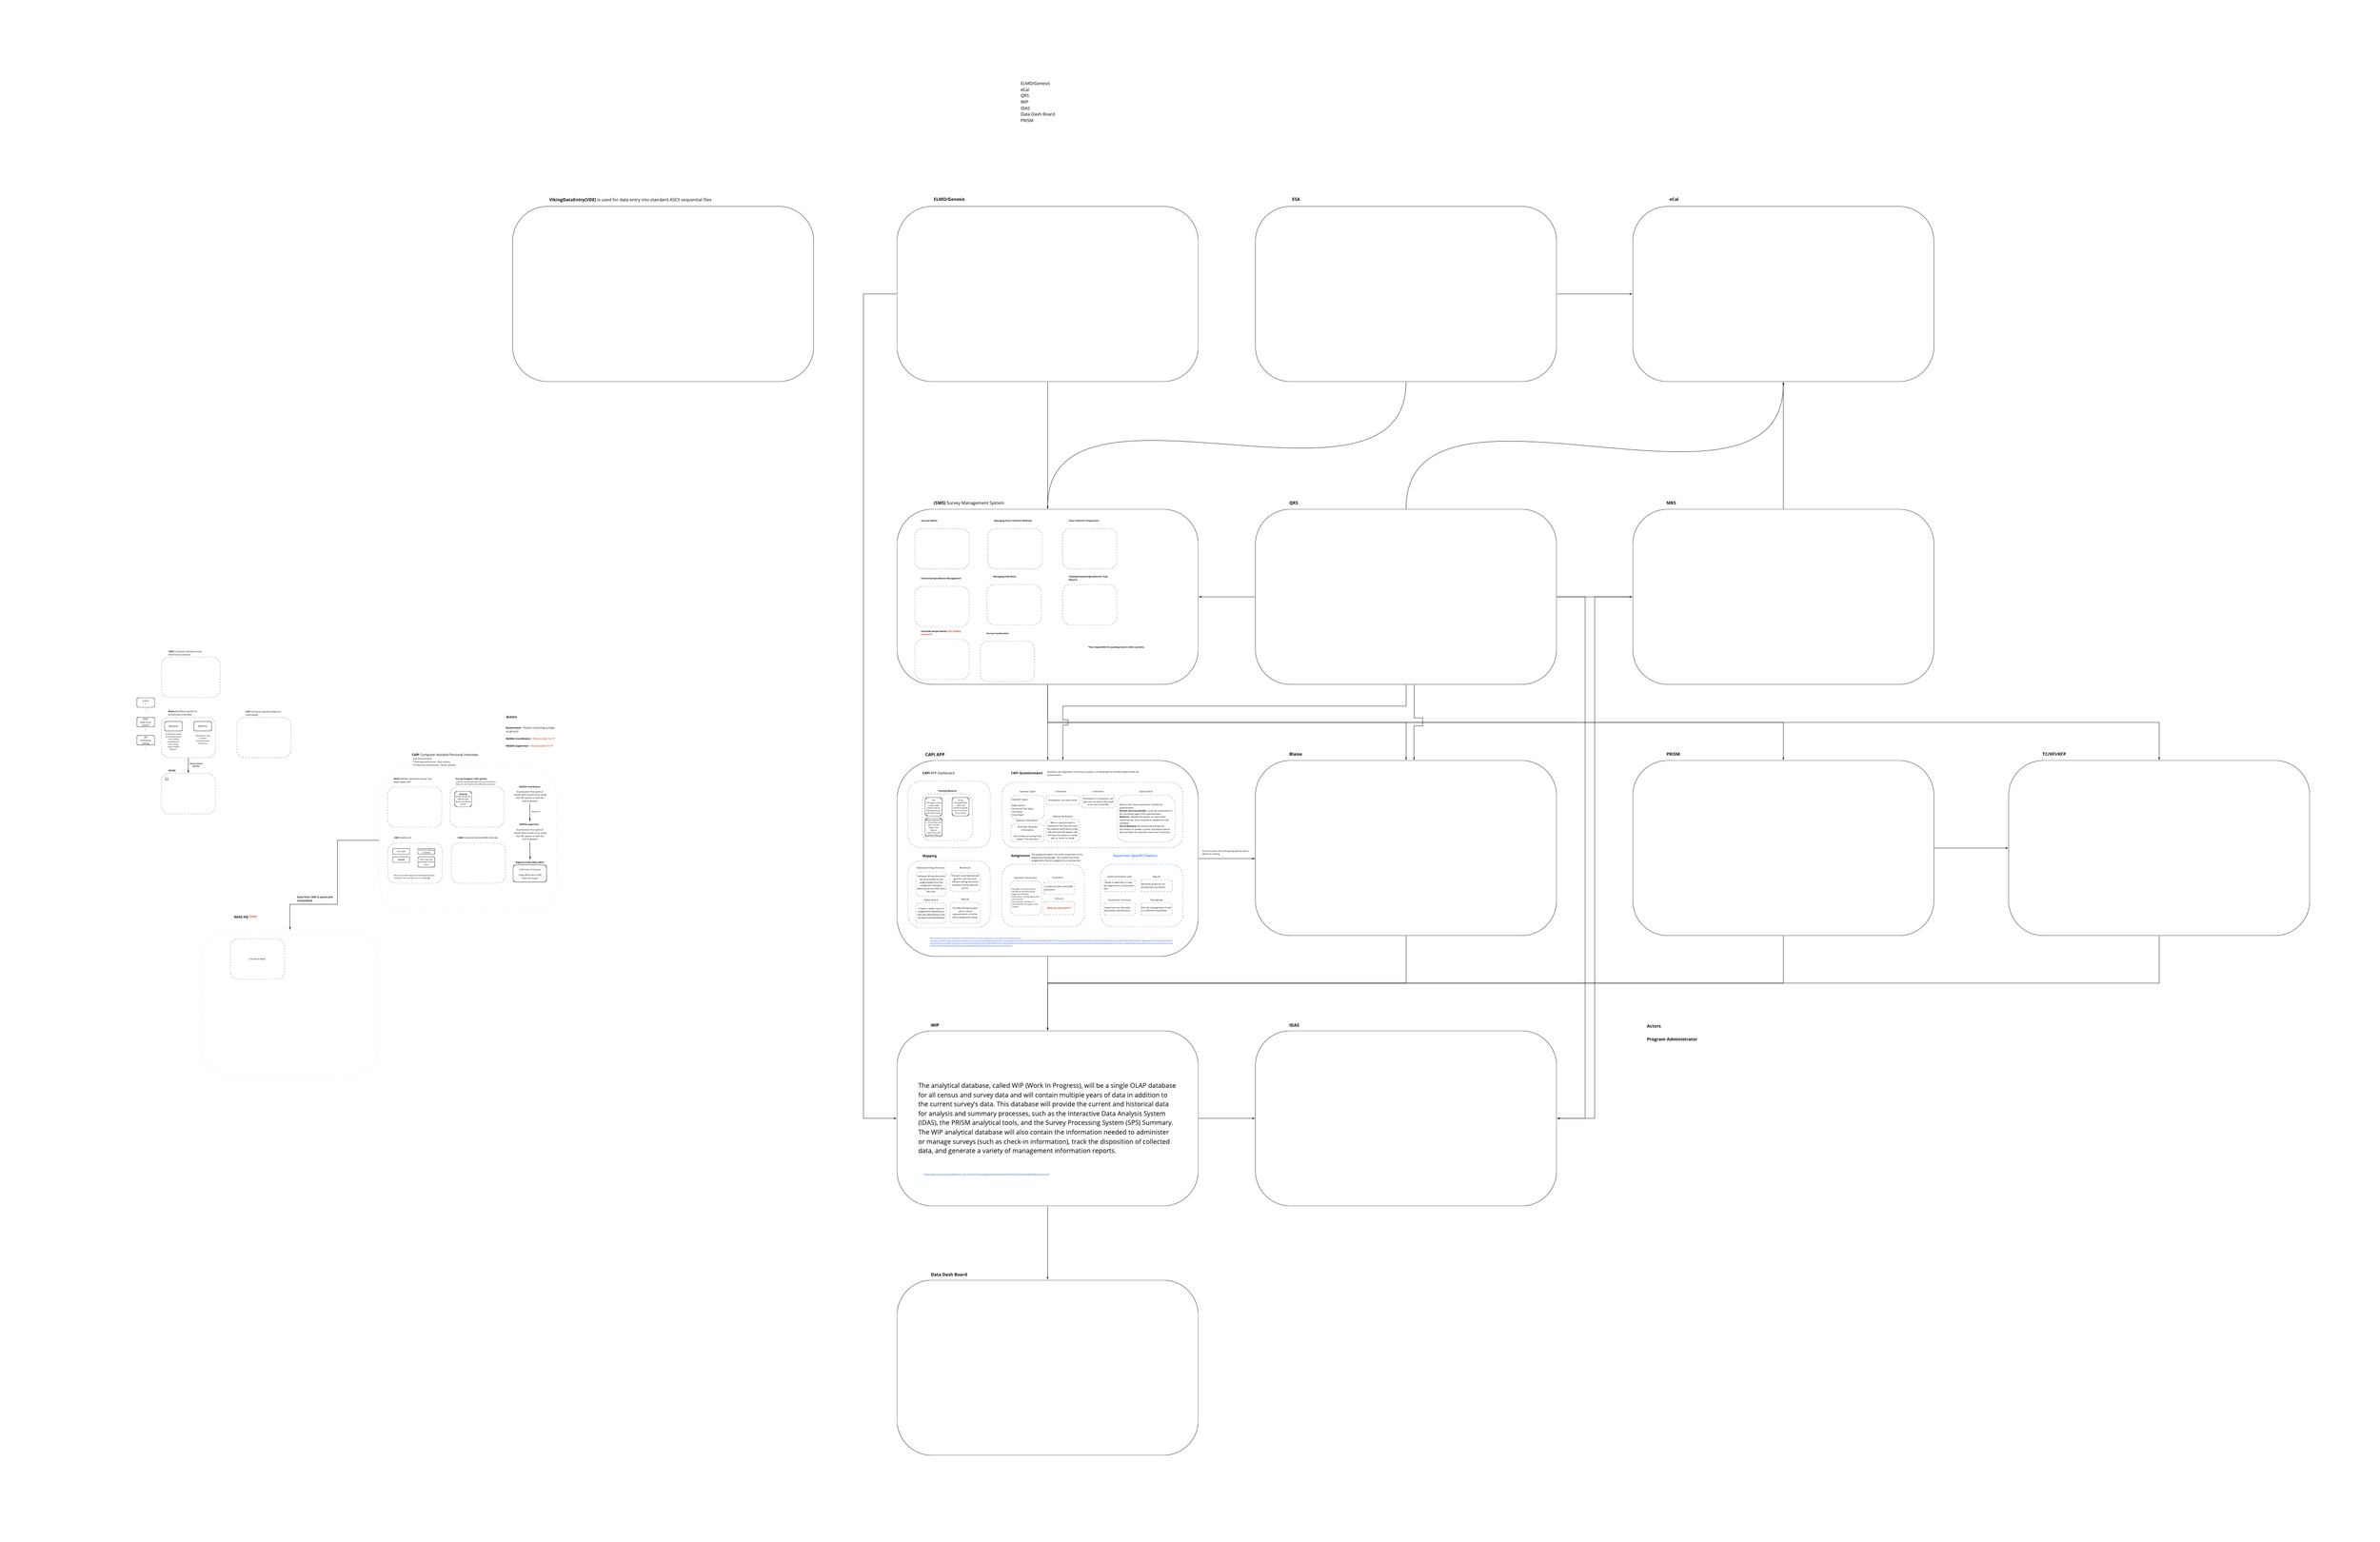
"The image above represents early work aimed at identifying systems." Early efforts mapped software across the organization on a Miro board, illustrating connections and information flow between departments.
[Image: "NASS 360" — early systems mapping visualization, software connections on a Miro board]

2. Ecosystem Mapping
"As more of the software ecosystem is identified, a clearer picture of the NASS ecosystem begins to emerge." Team members traced information flows and distributed workload through collaborative sticky-note documentation.
[Image: "NASS System Diagram" — expanded ecosystem visualization with sticky notes showing software categories and information flows]
3. Interview Research
"Conducting the secondary research enabled the interviewer to be at least somewhat informed about each interviewee's responsibilities." Twenty-eight hour-and-a-half interviews gathered quantitative commonalities and identified pain points from participants' perspectives.
[Image: interview scene photograph, stock image of person in professional setting]
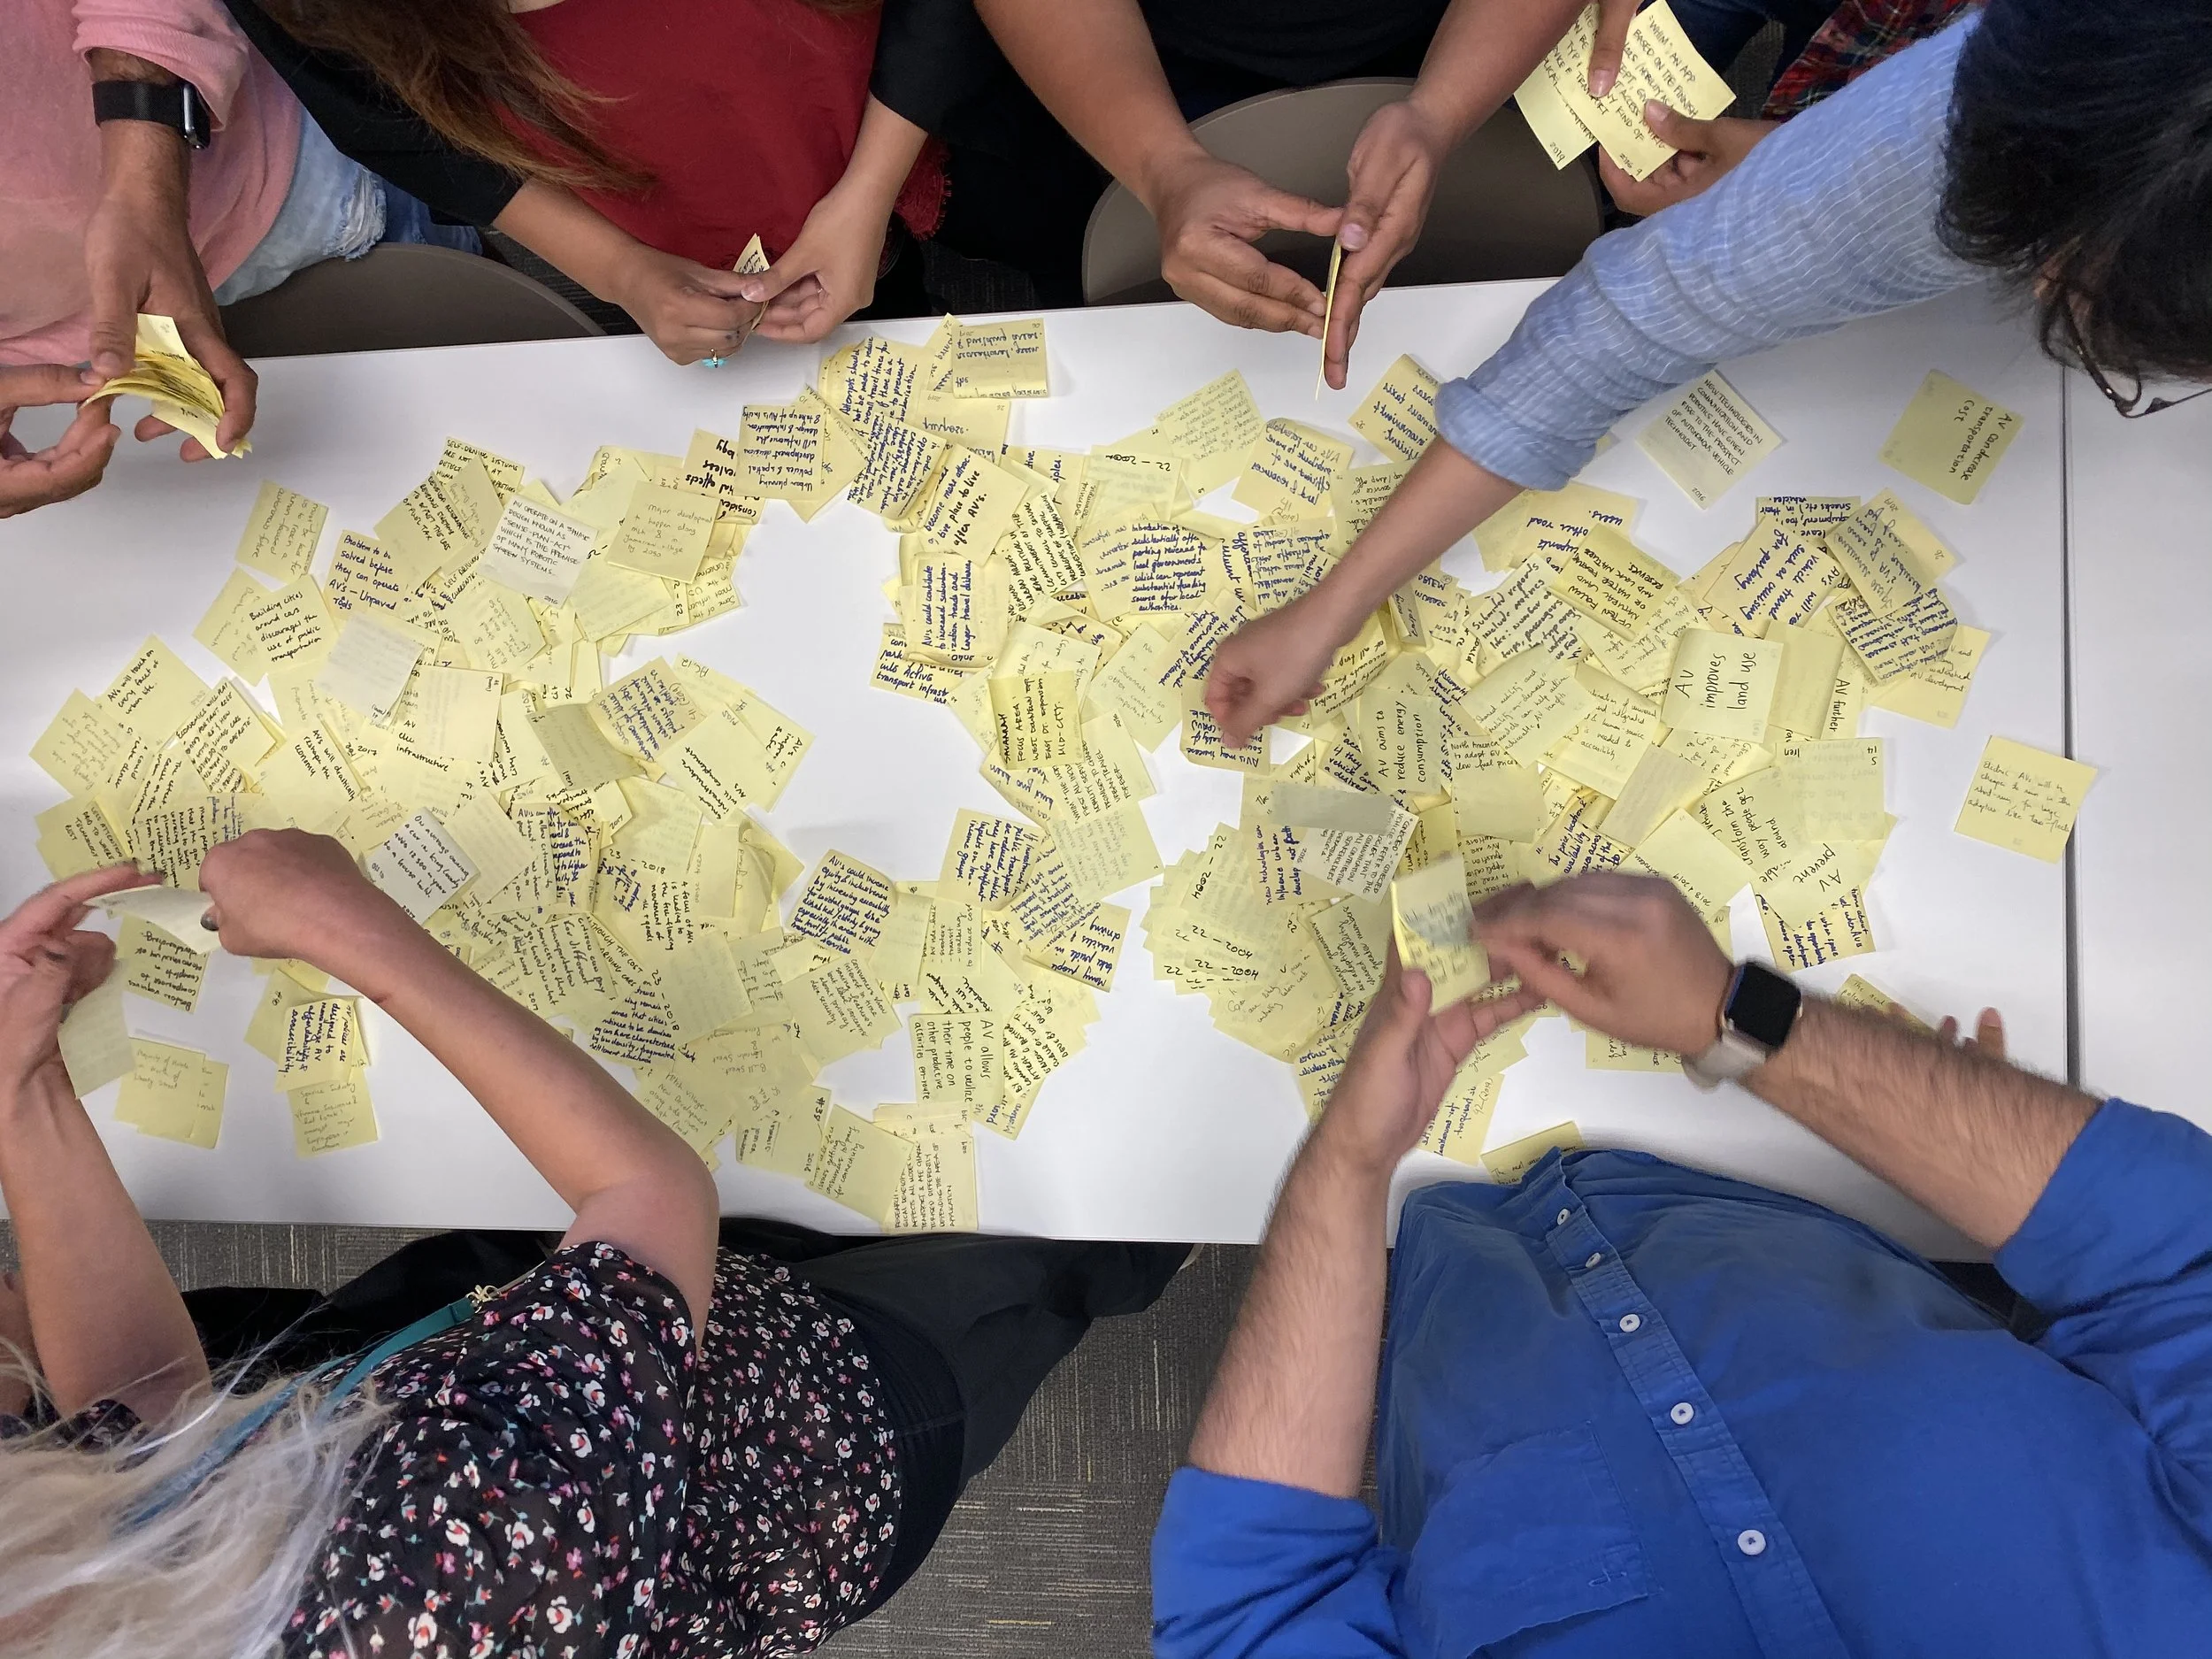
4. Data Synthesis
"The insights gathered through the interview process were broken down into individual points and then codified into organic clusters." Data points with similar themes were grouped, with new categories created for original thoughts and recategorization when categories exceeded eight items.
[Image: data clustering visualization — codified data points and thematic groupings]
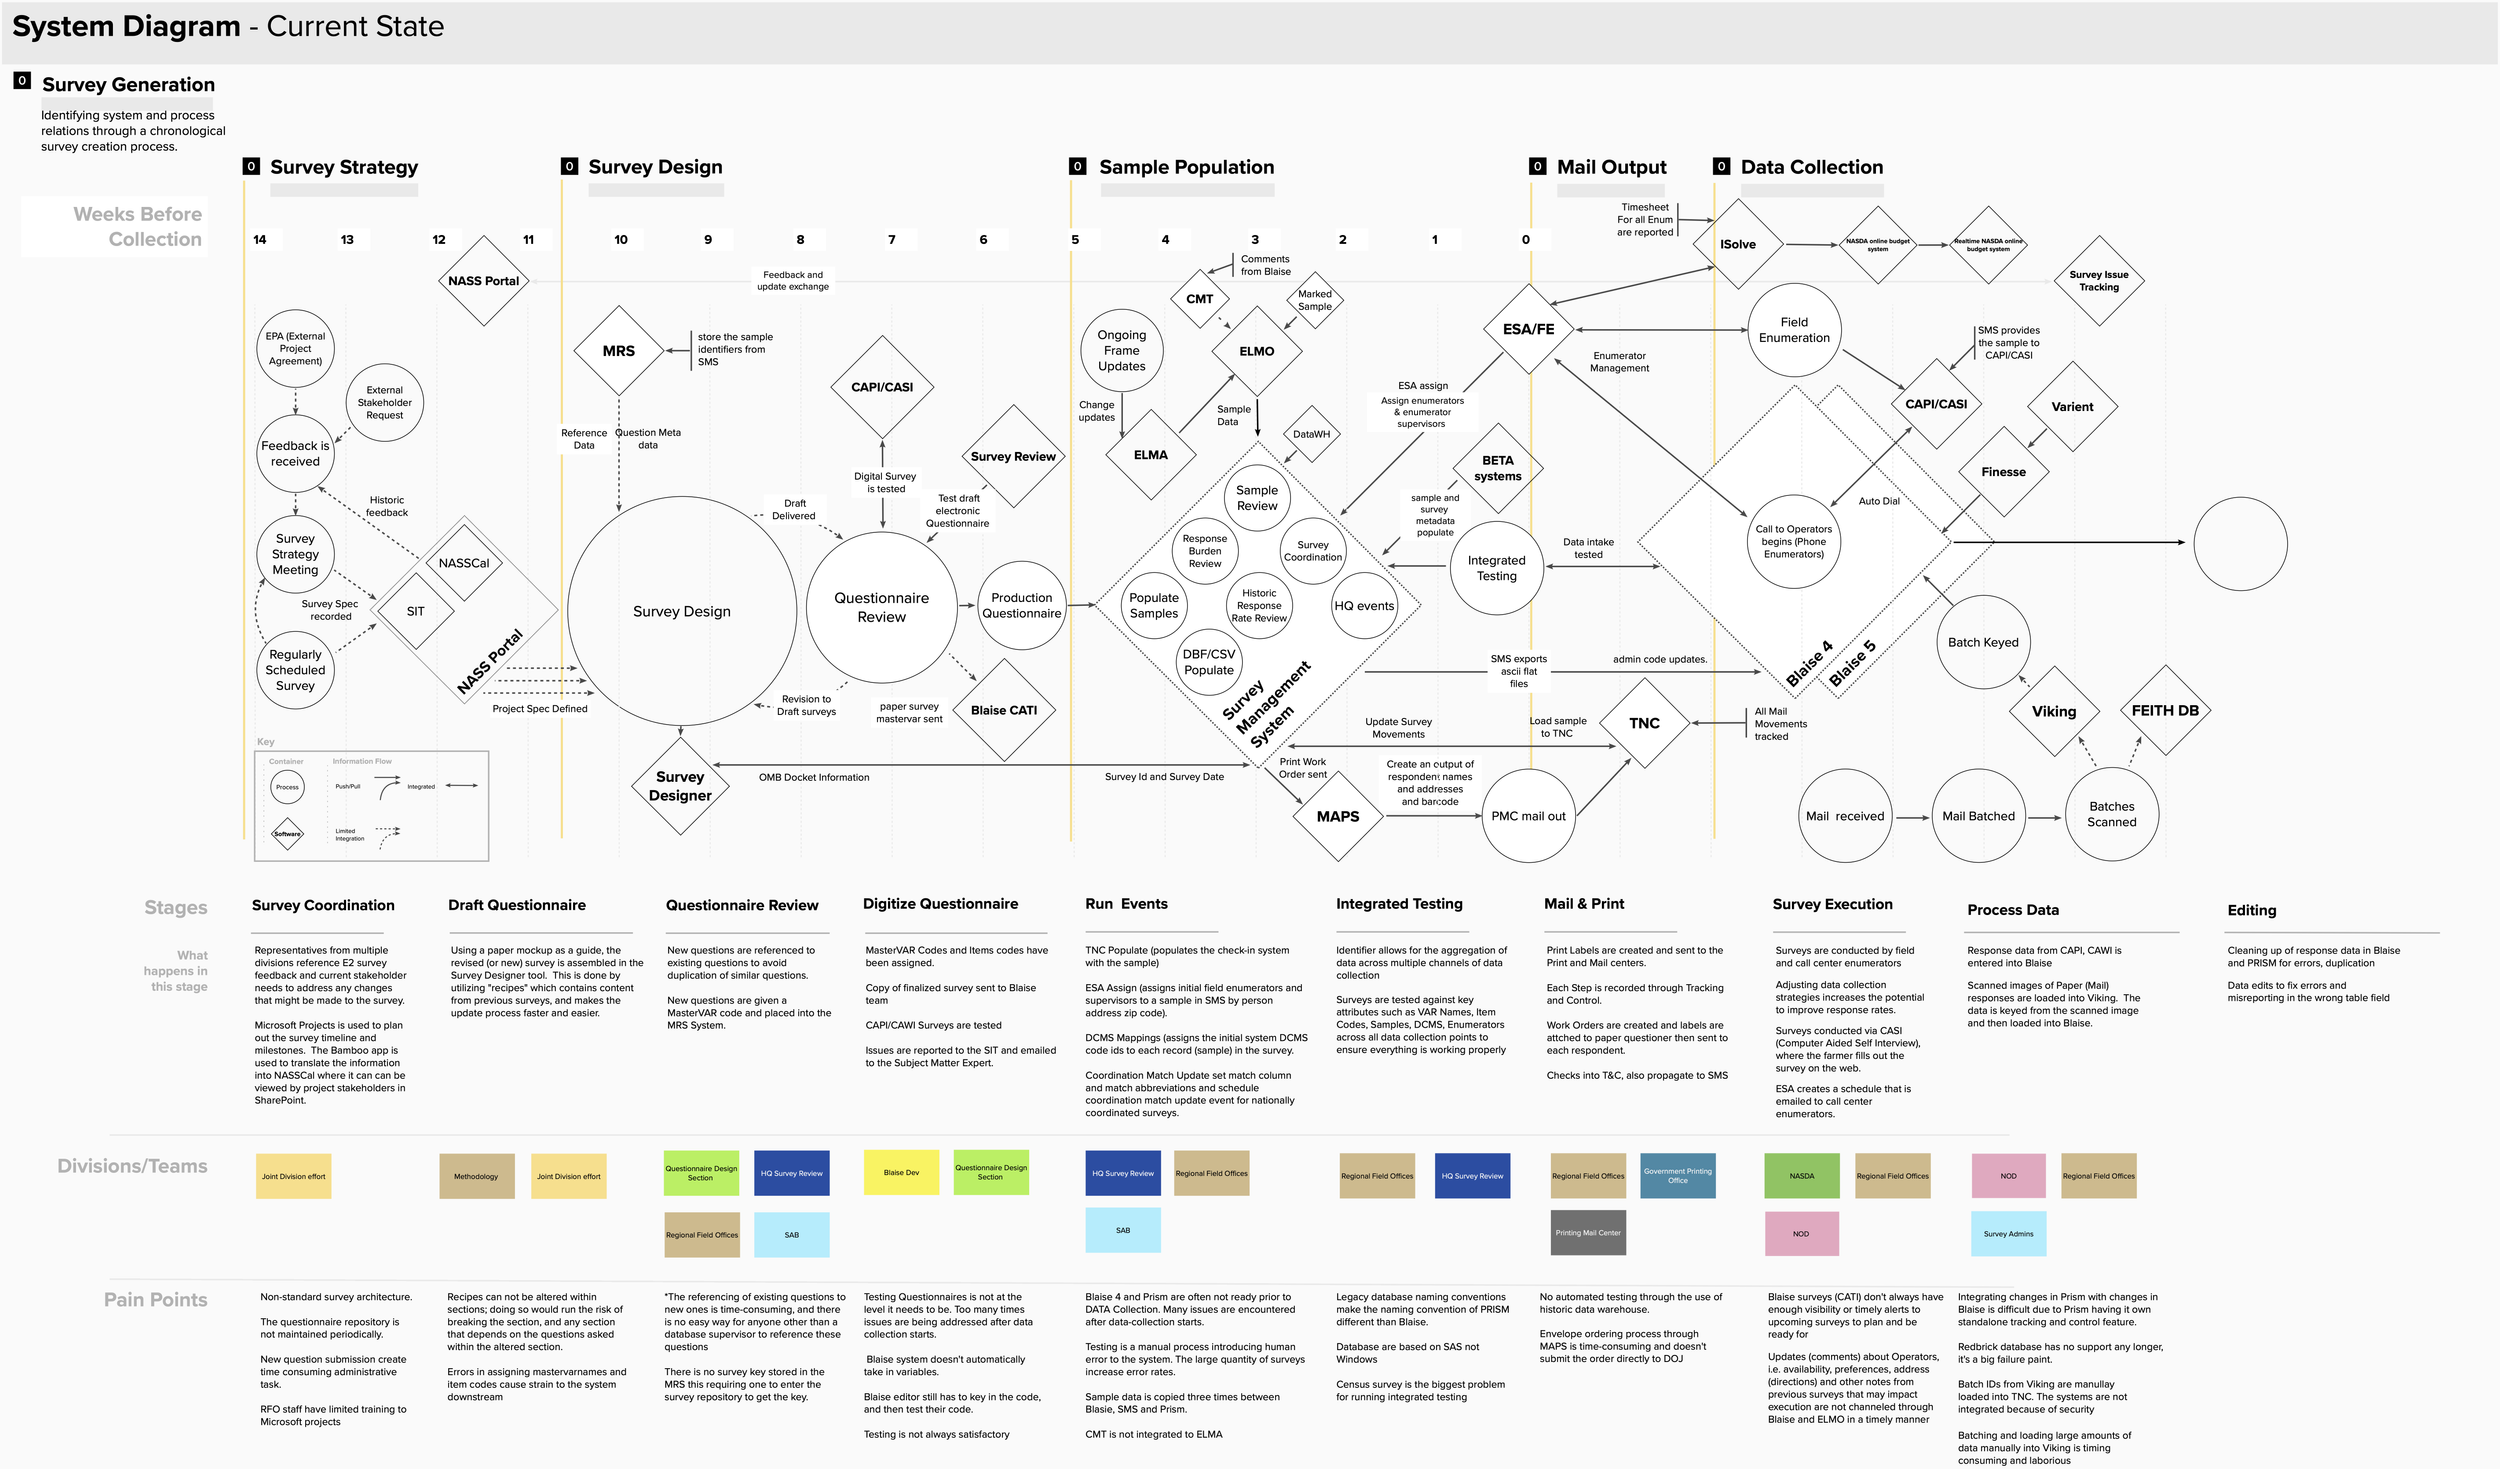
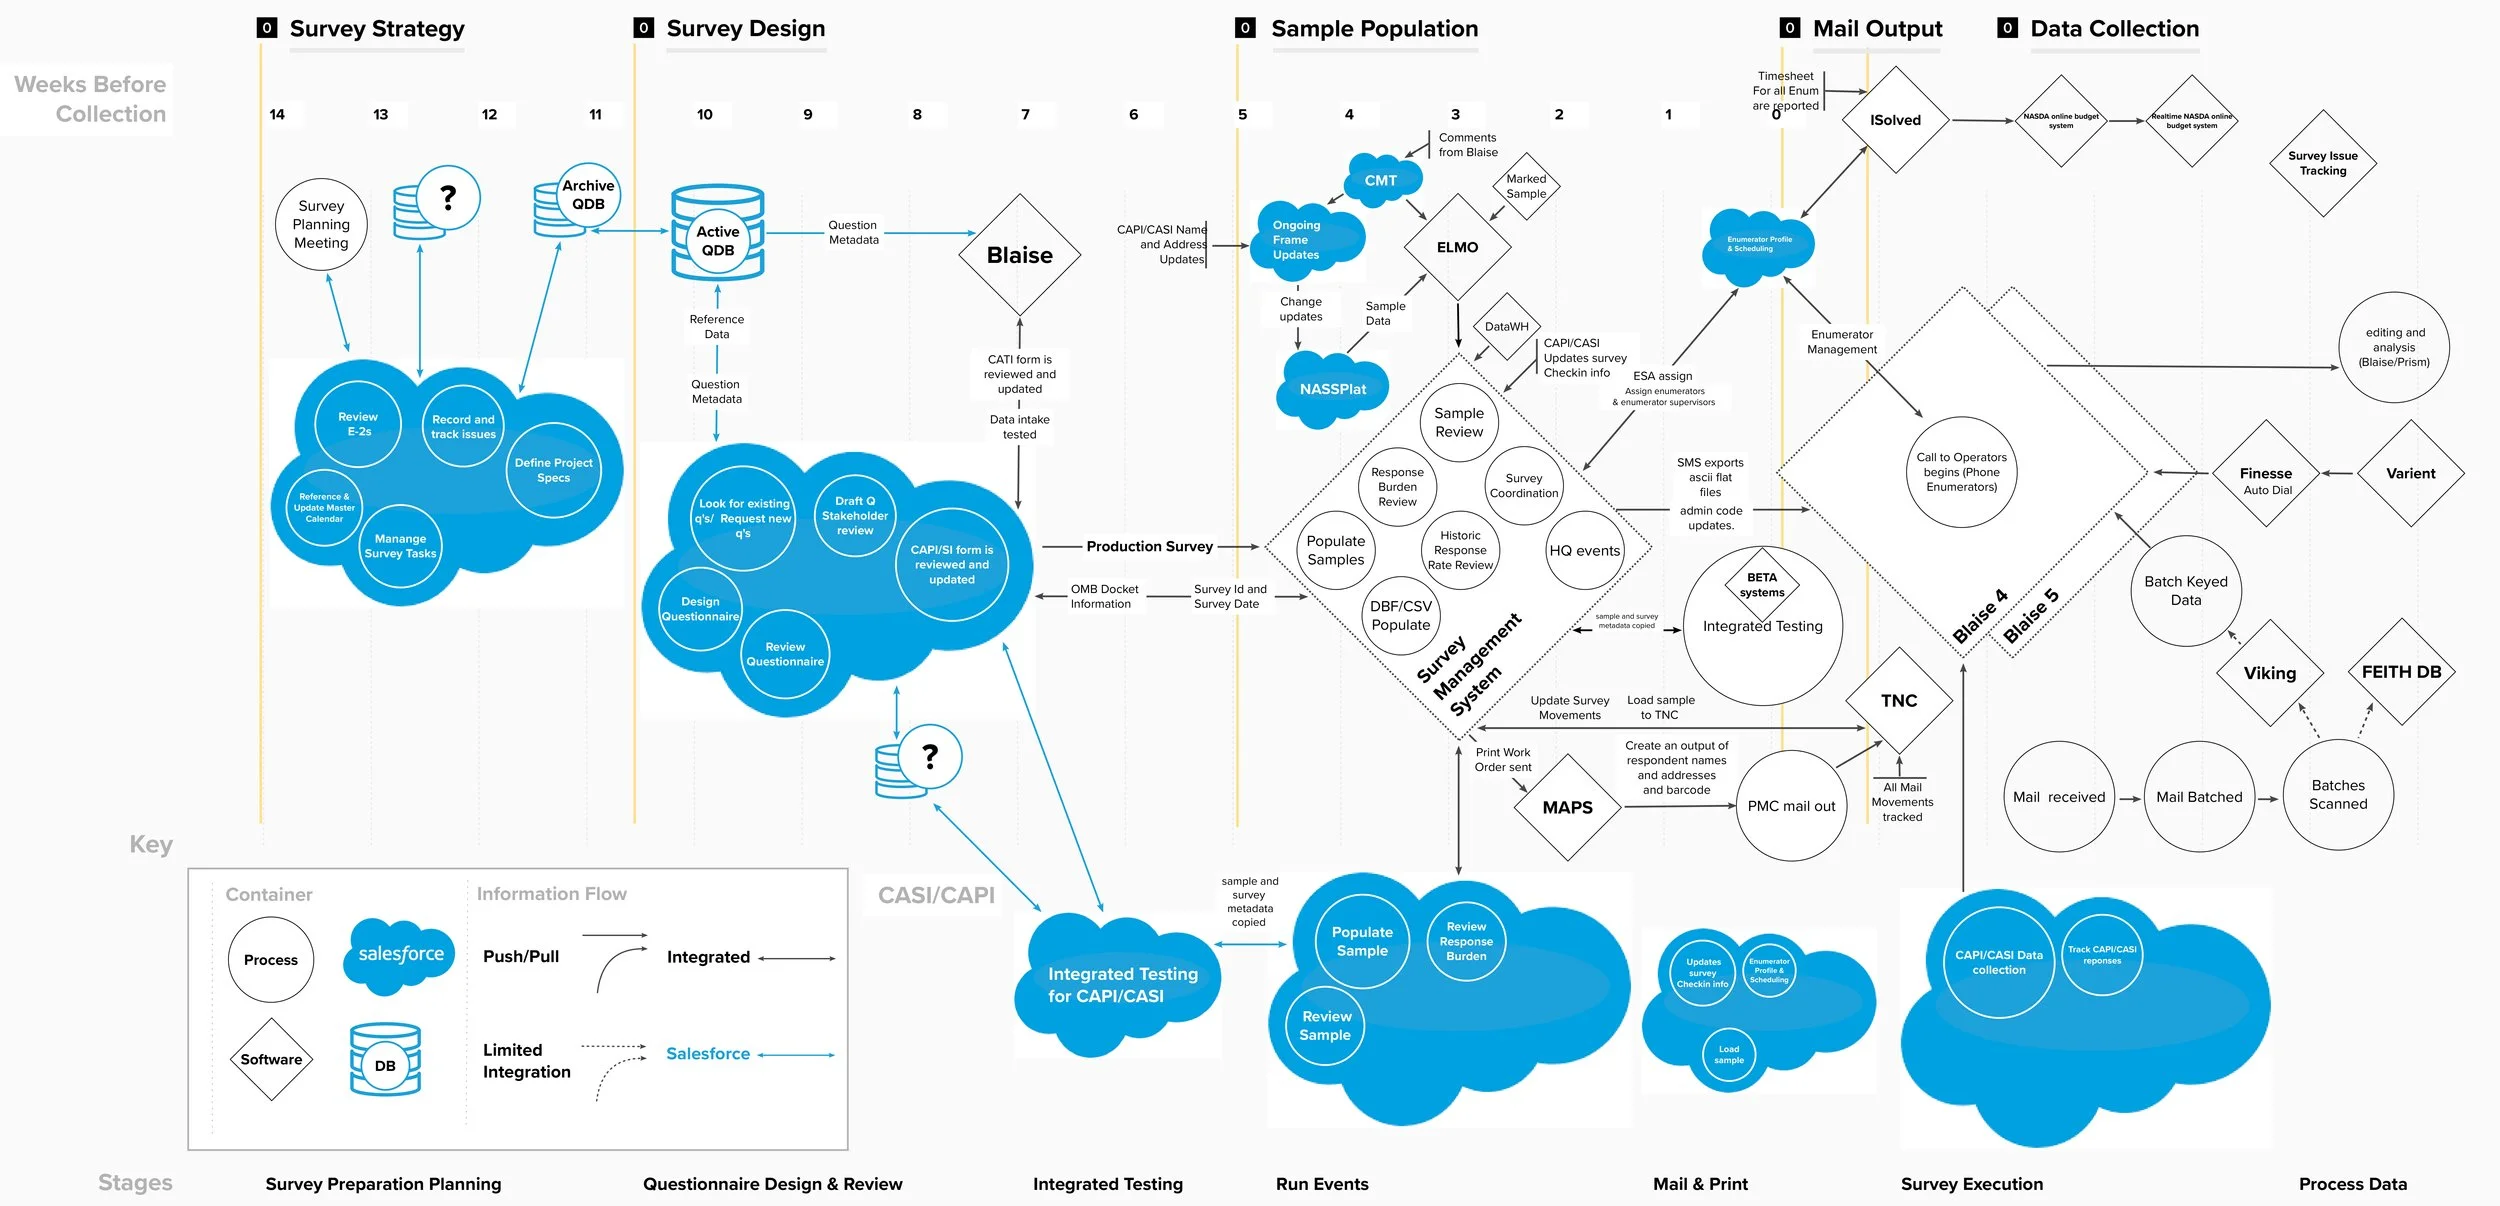
5. Human-Technical System Diagram
"After codifying the data, I took the initiative to synthesize it into a single cohesive document, which I titled the Human-Technical System Diagram." This comprehensive document organized stages chronologically, outlining activities, responsible divisions, and pain points. It became valuable for onboarding new team members.
[Image: Human-Technical System Diagram — comprehensive timeline-based diagram organizing survey stages, divisions, and pain points; center focus of the case study]

6. Future State Planning
"With a clear understanding of the current state, the team was now able to strategize on the future state." The proposed changes incorporated Salesforce as the selected SaaS solution, allowing side-by-side comparison of current versus future states.
[Image: future state comparison diagram — side-by-side visualization integrating Salesforce into proposed changes]
Outcome: "The work shown here does not incapsulate the amount of trust building and relationship management that took place. After presenting all the work conducted steampunk was awarded a multimillion dollar contract to move forward with the proposed future state."
7. JIRA Story Development
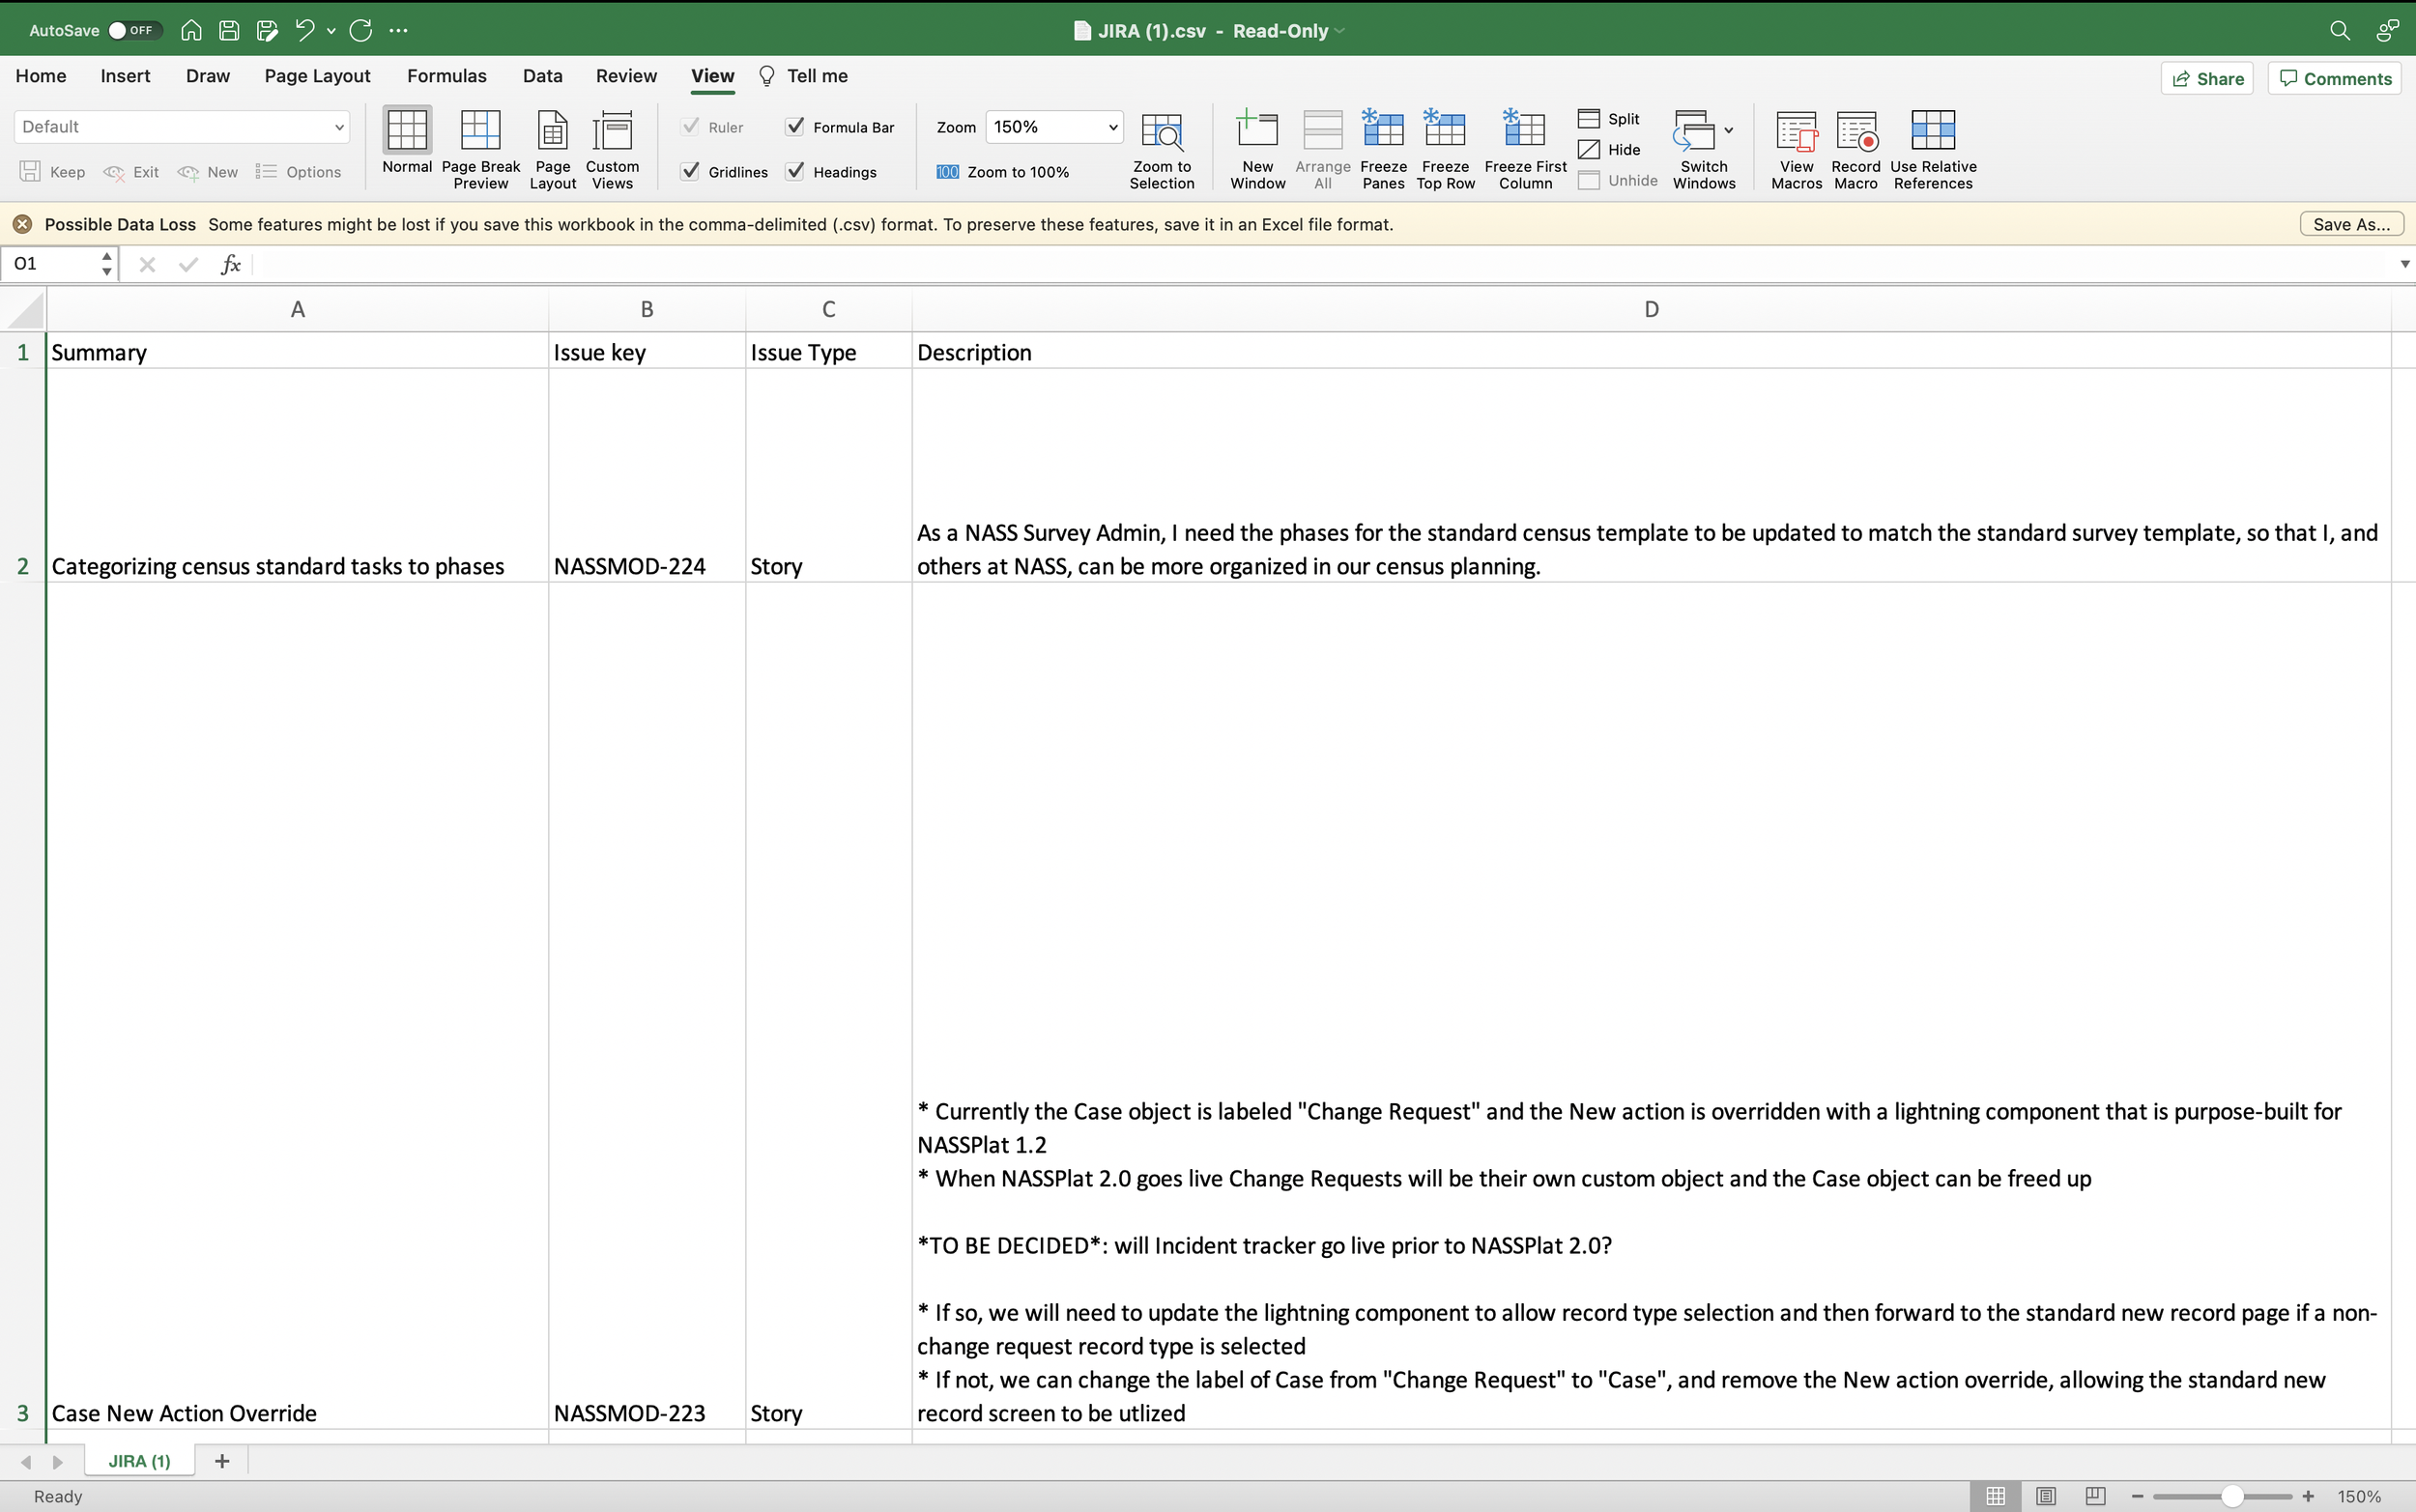
"Once the decision was made to move forward with the proposed future state, I was tasked with writing the stories for JIRA." Wrote 176 user stories detailing implementation steps, leveraging a dual role as both communicator and technical NASS expert.
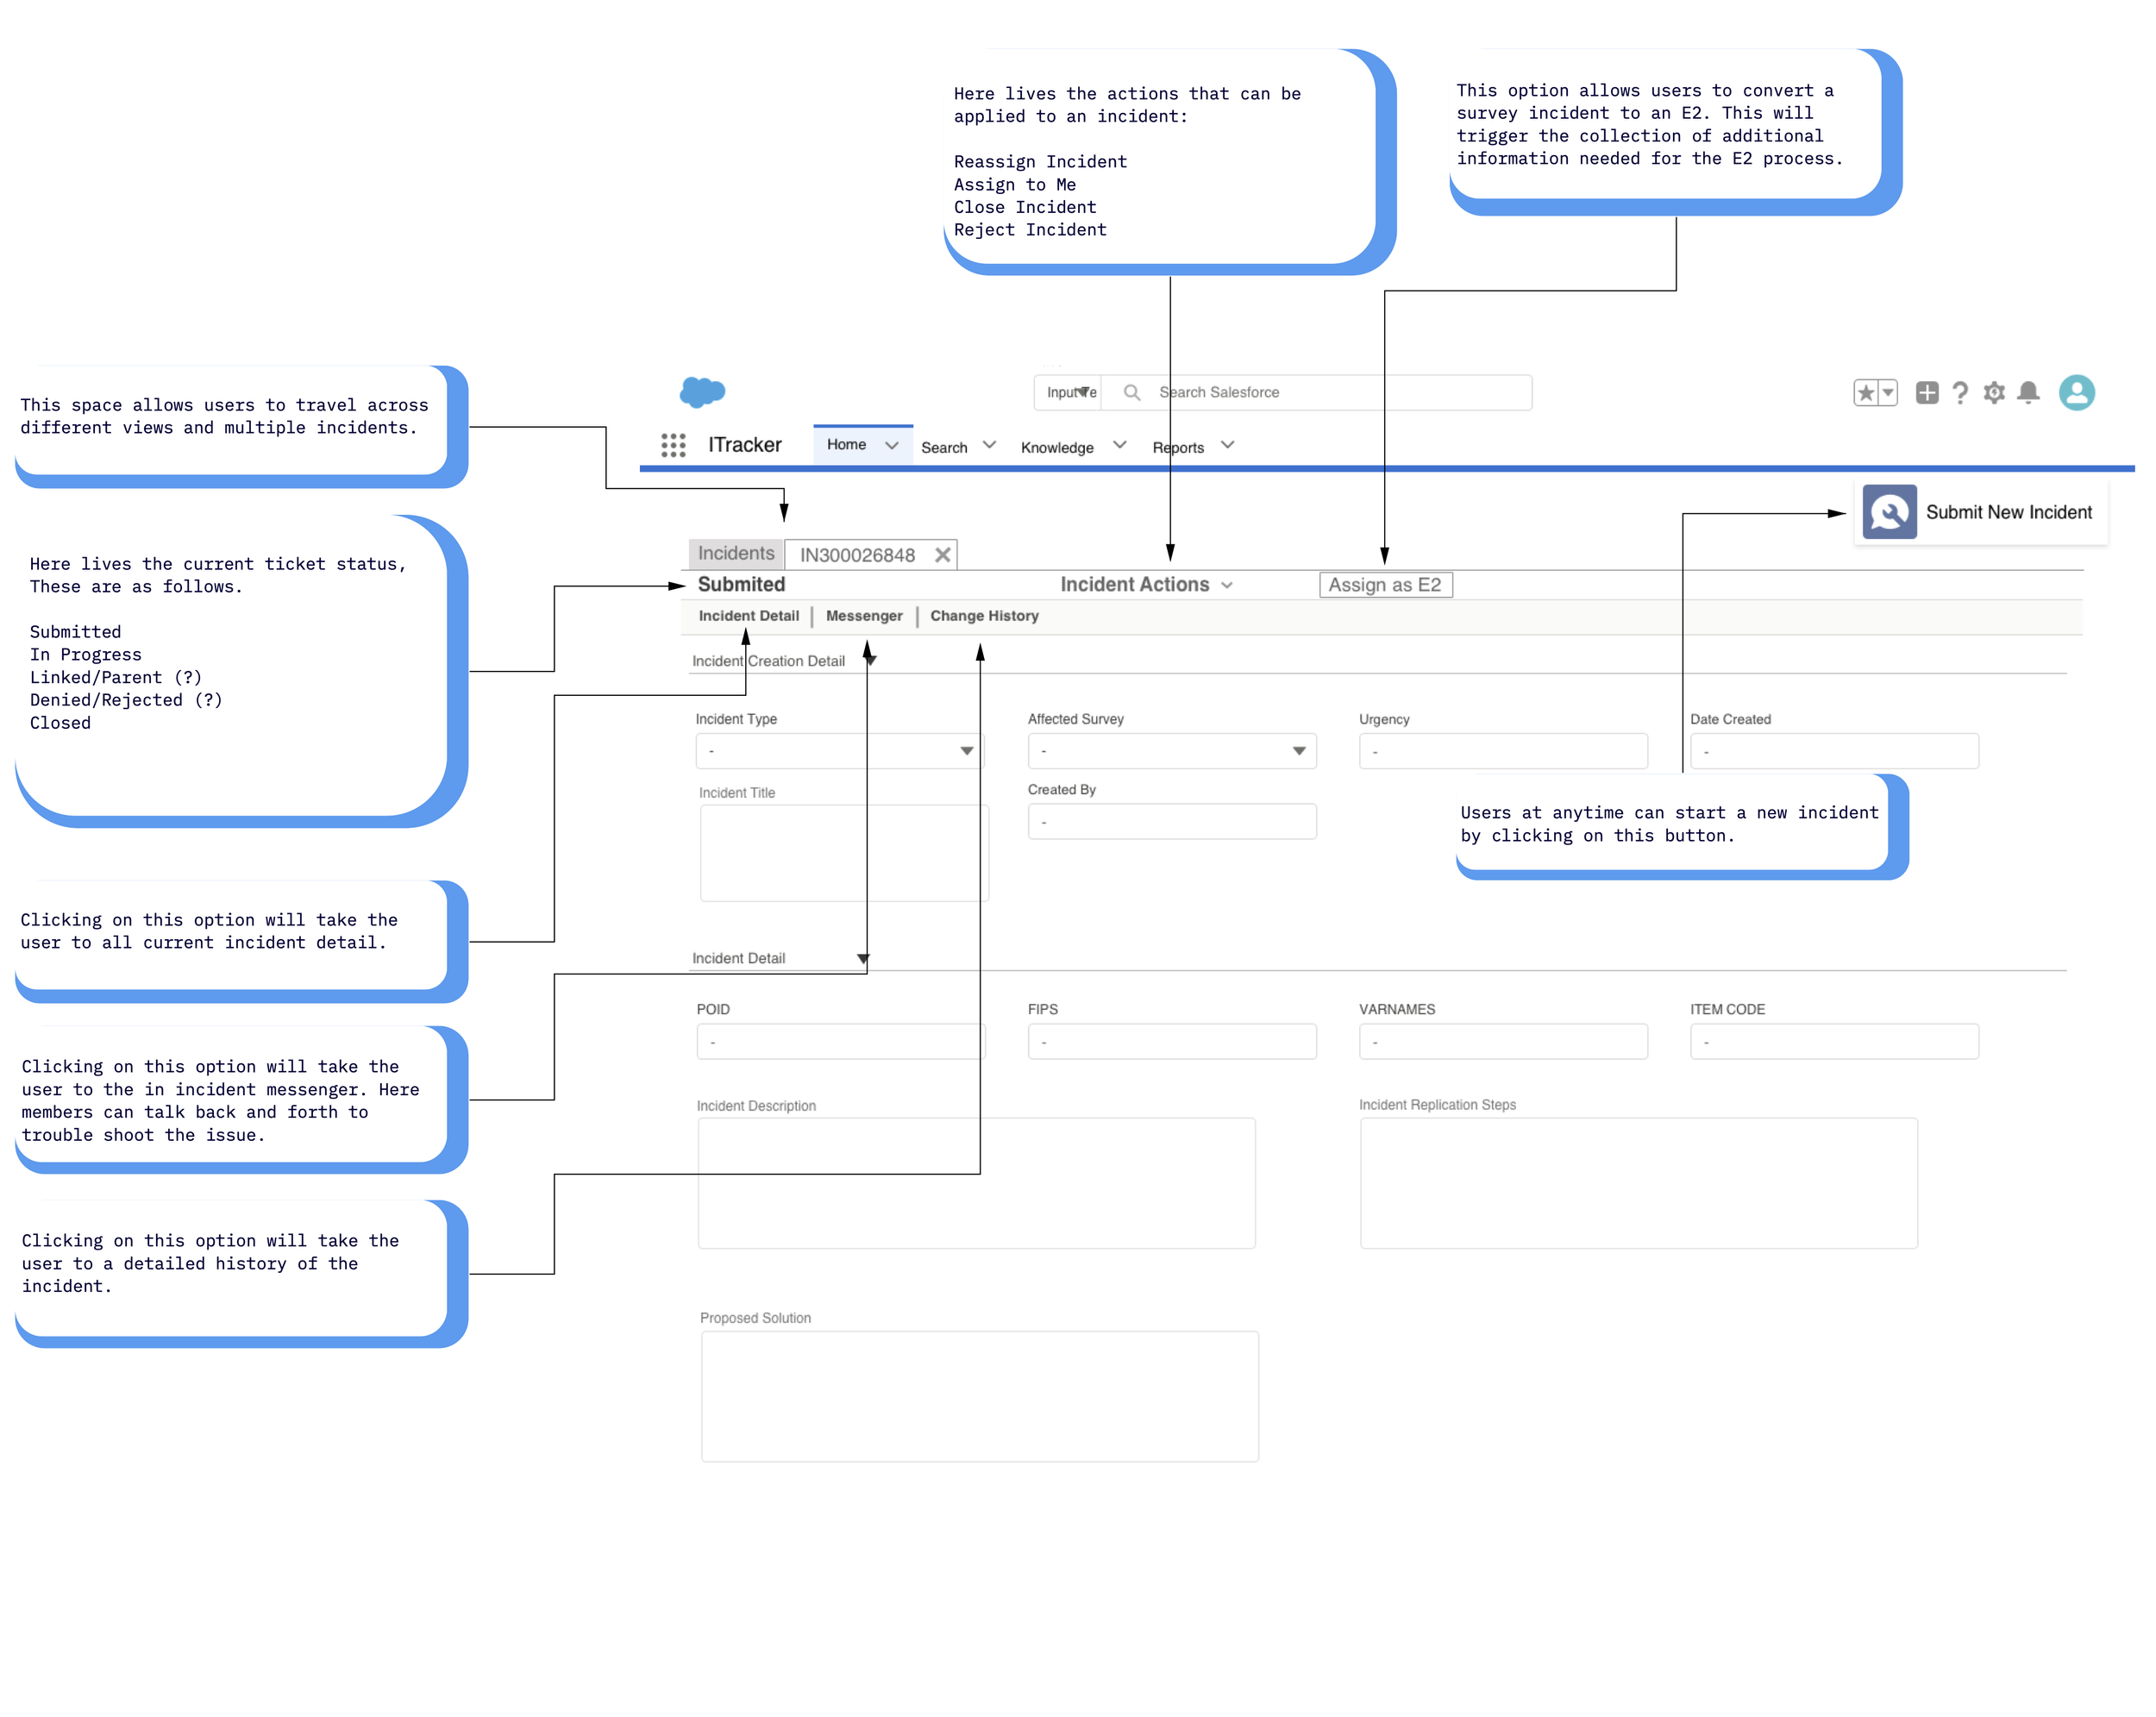
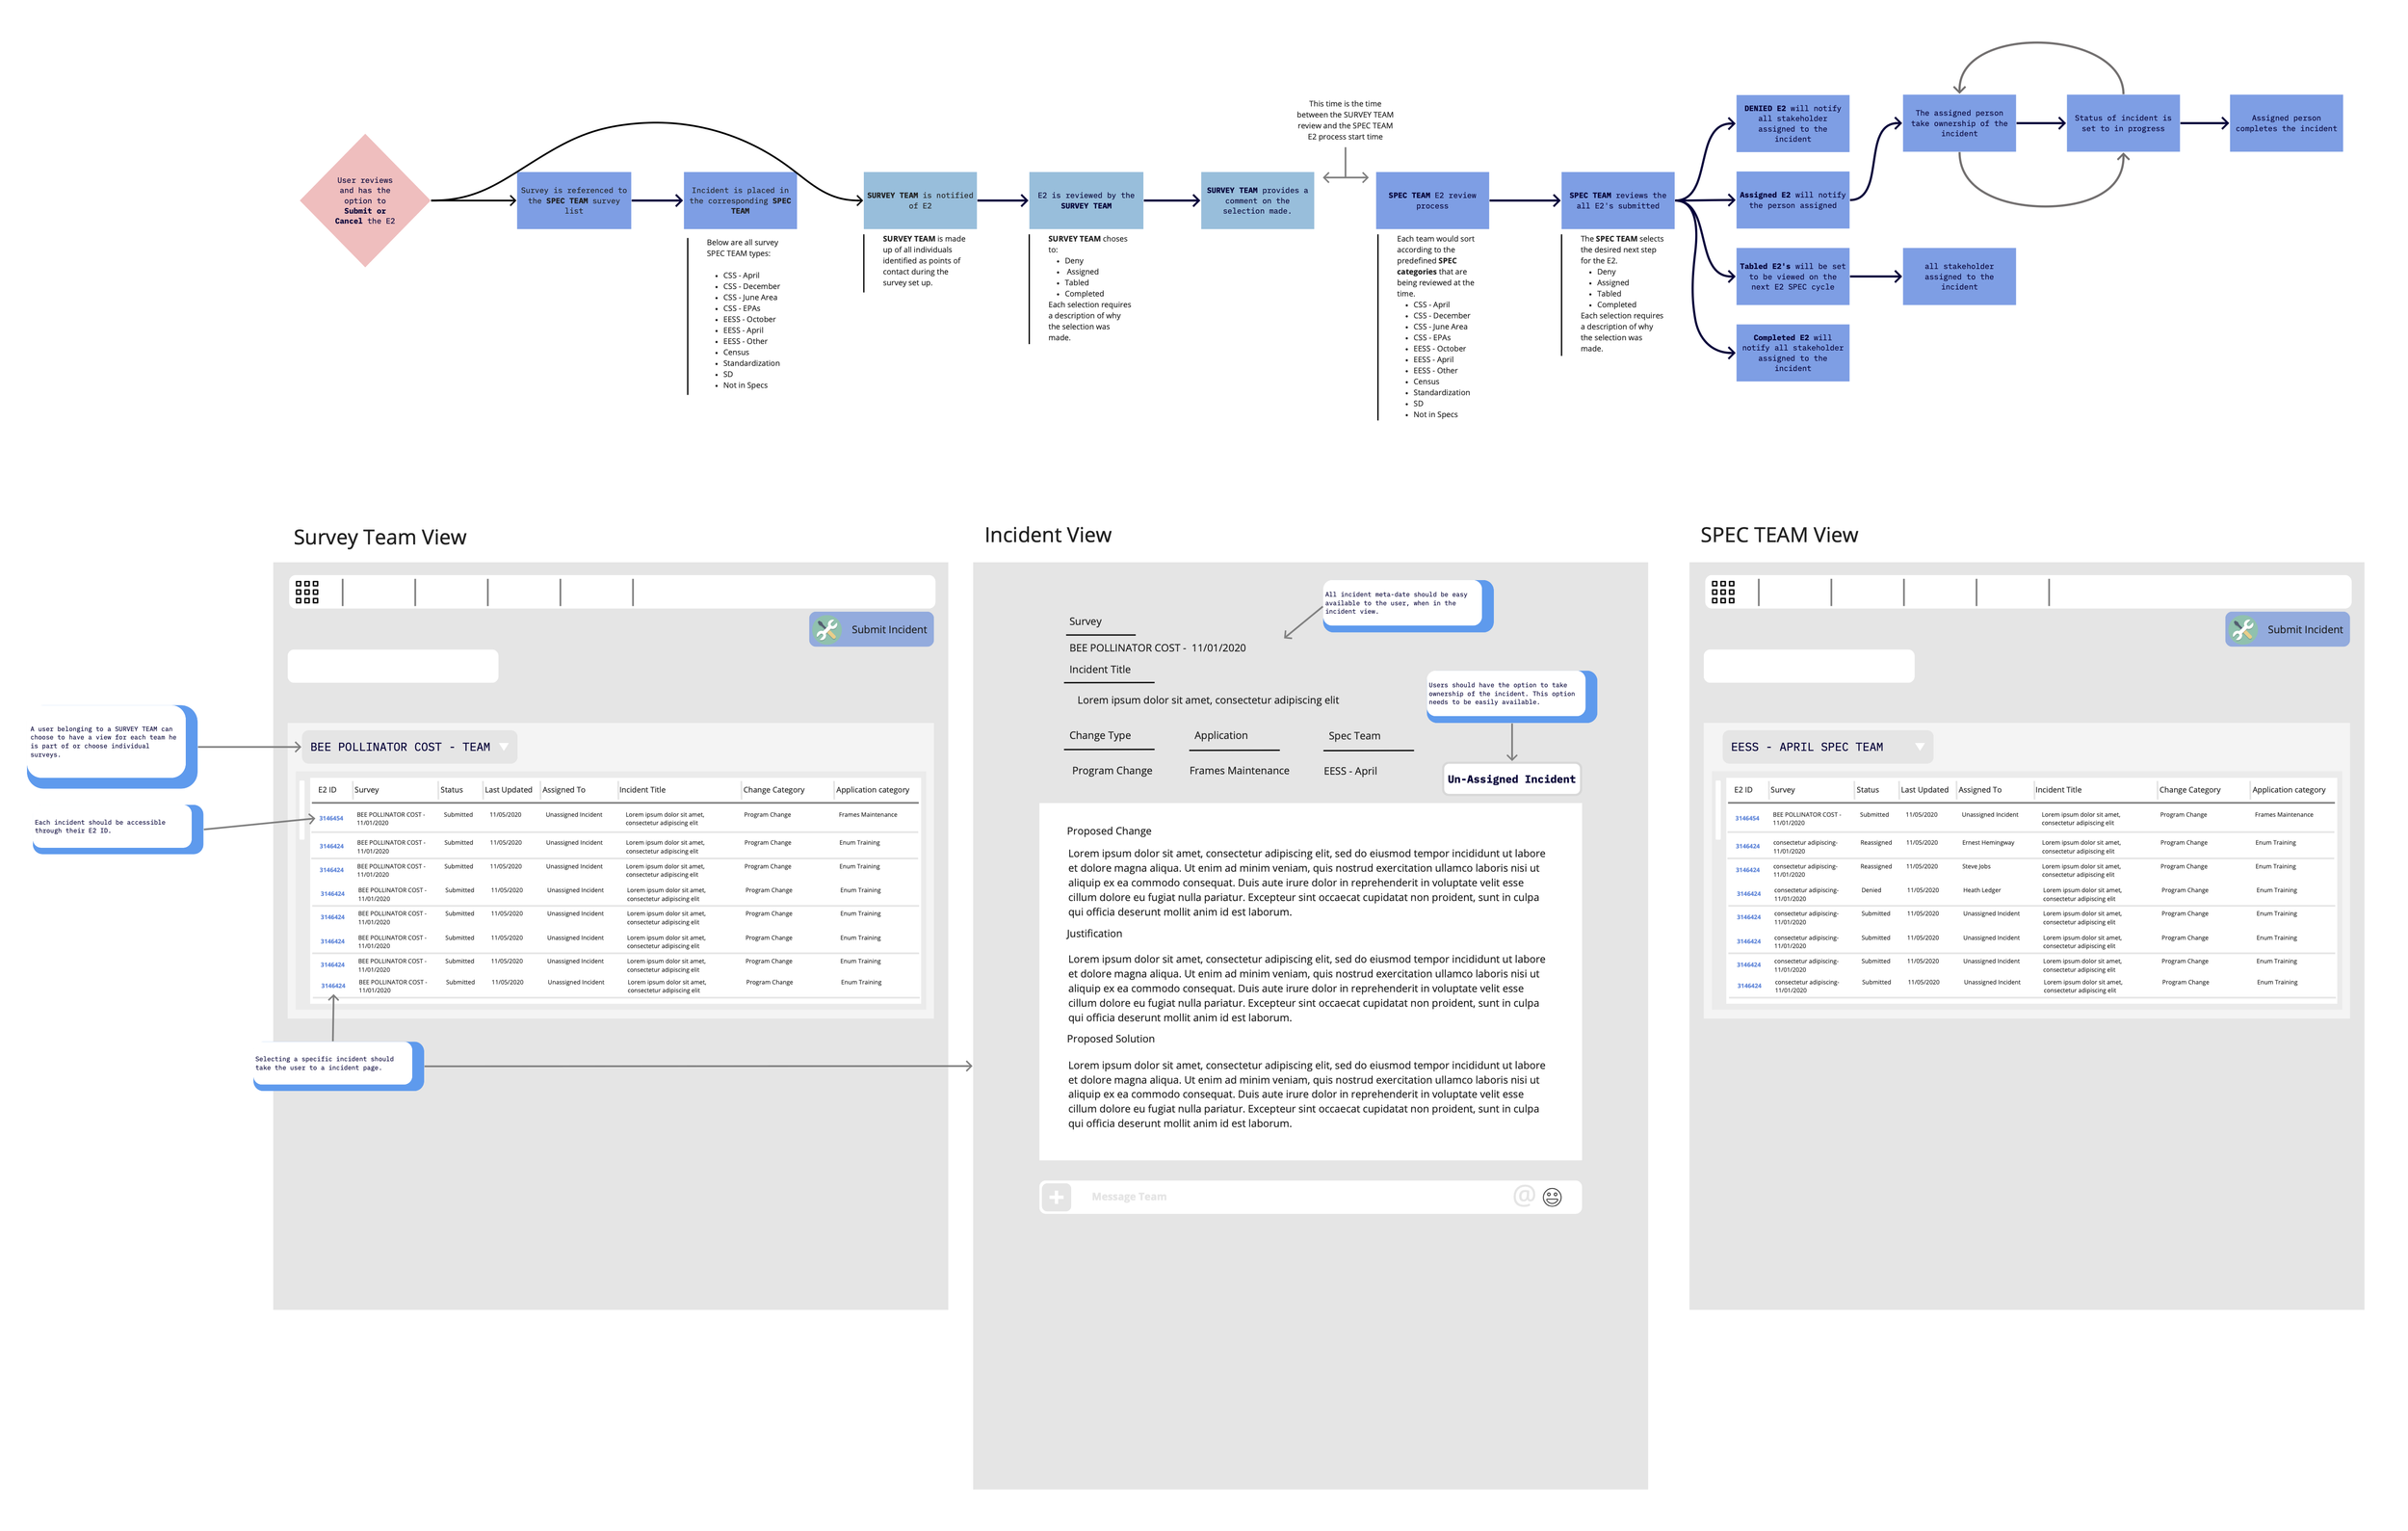
8. Incident Tracking System
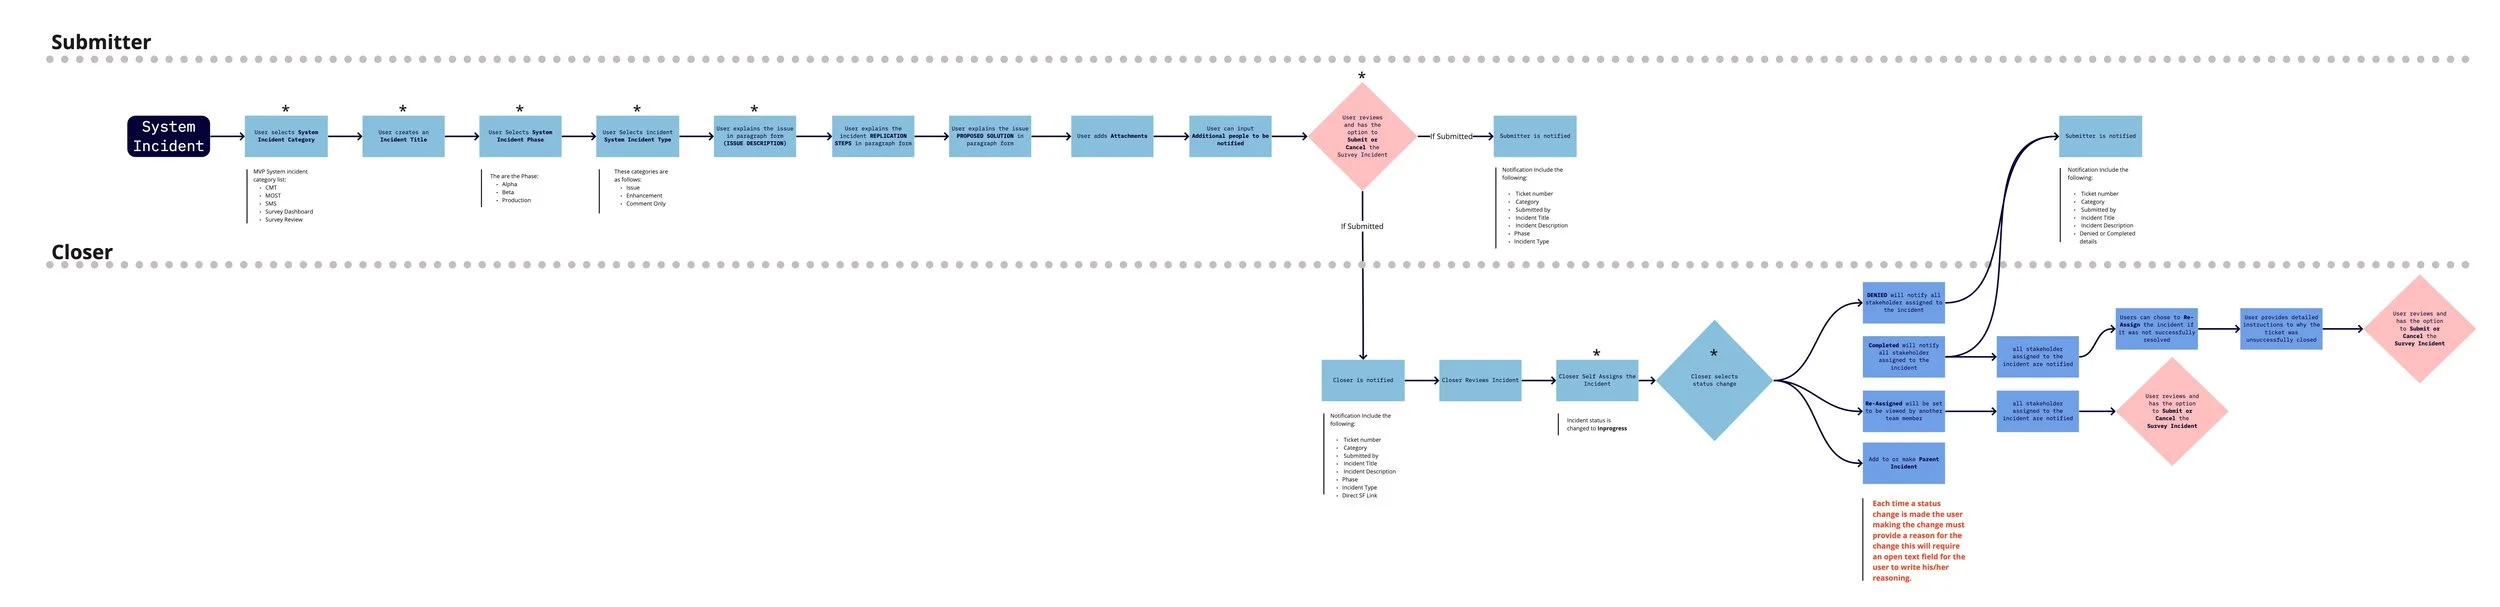
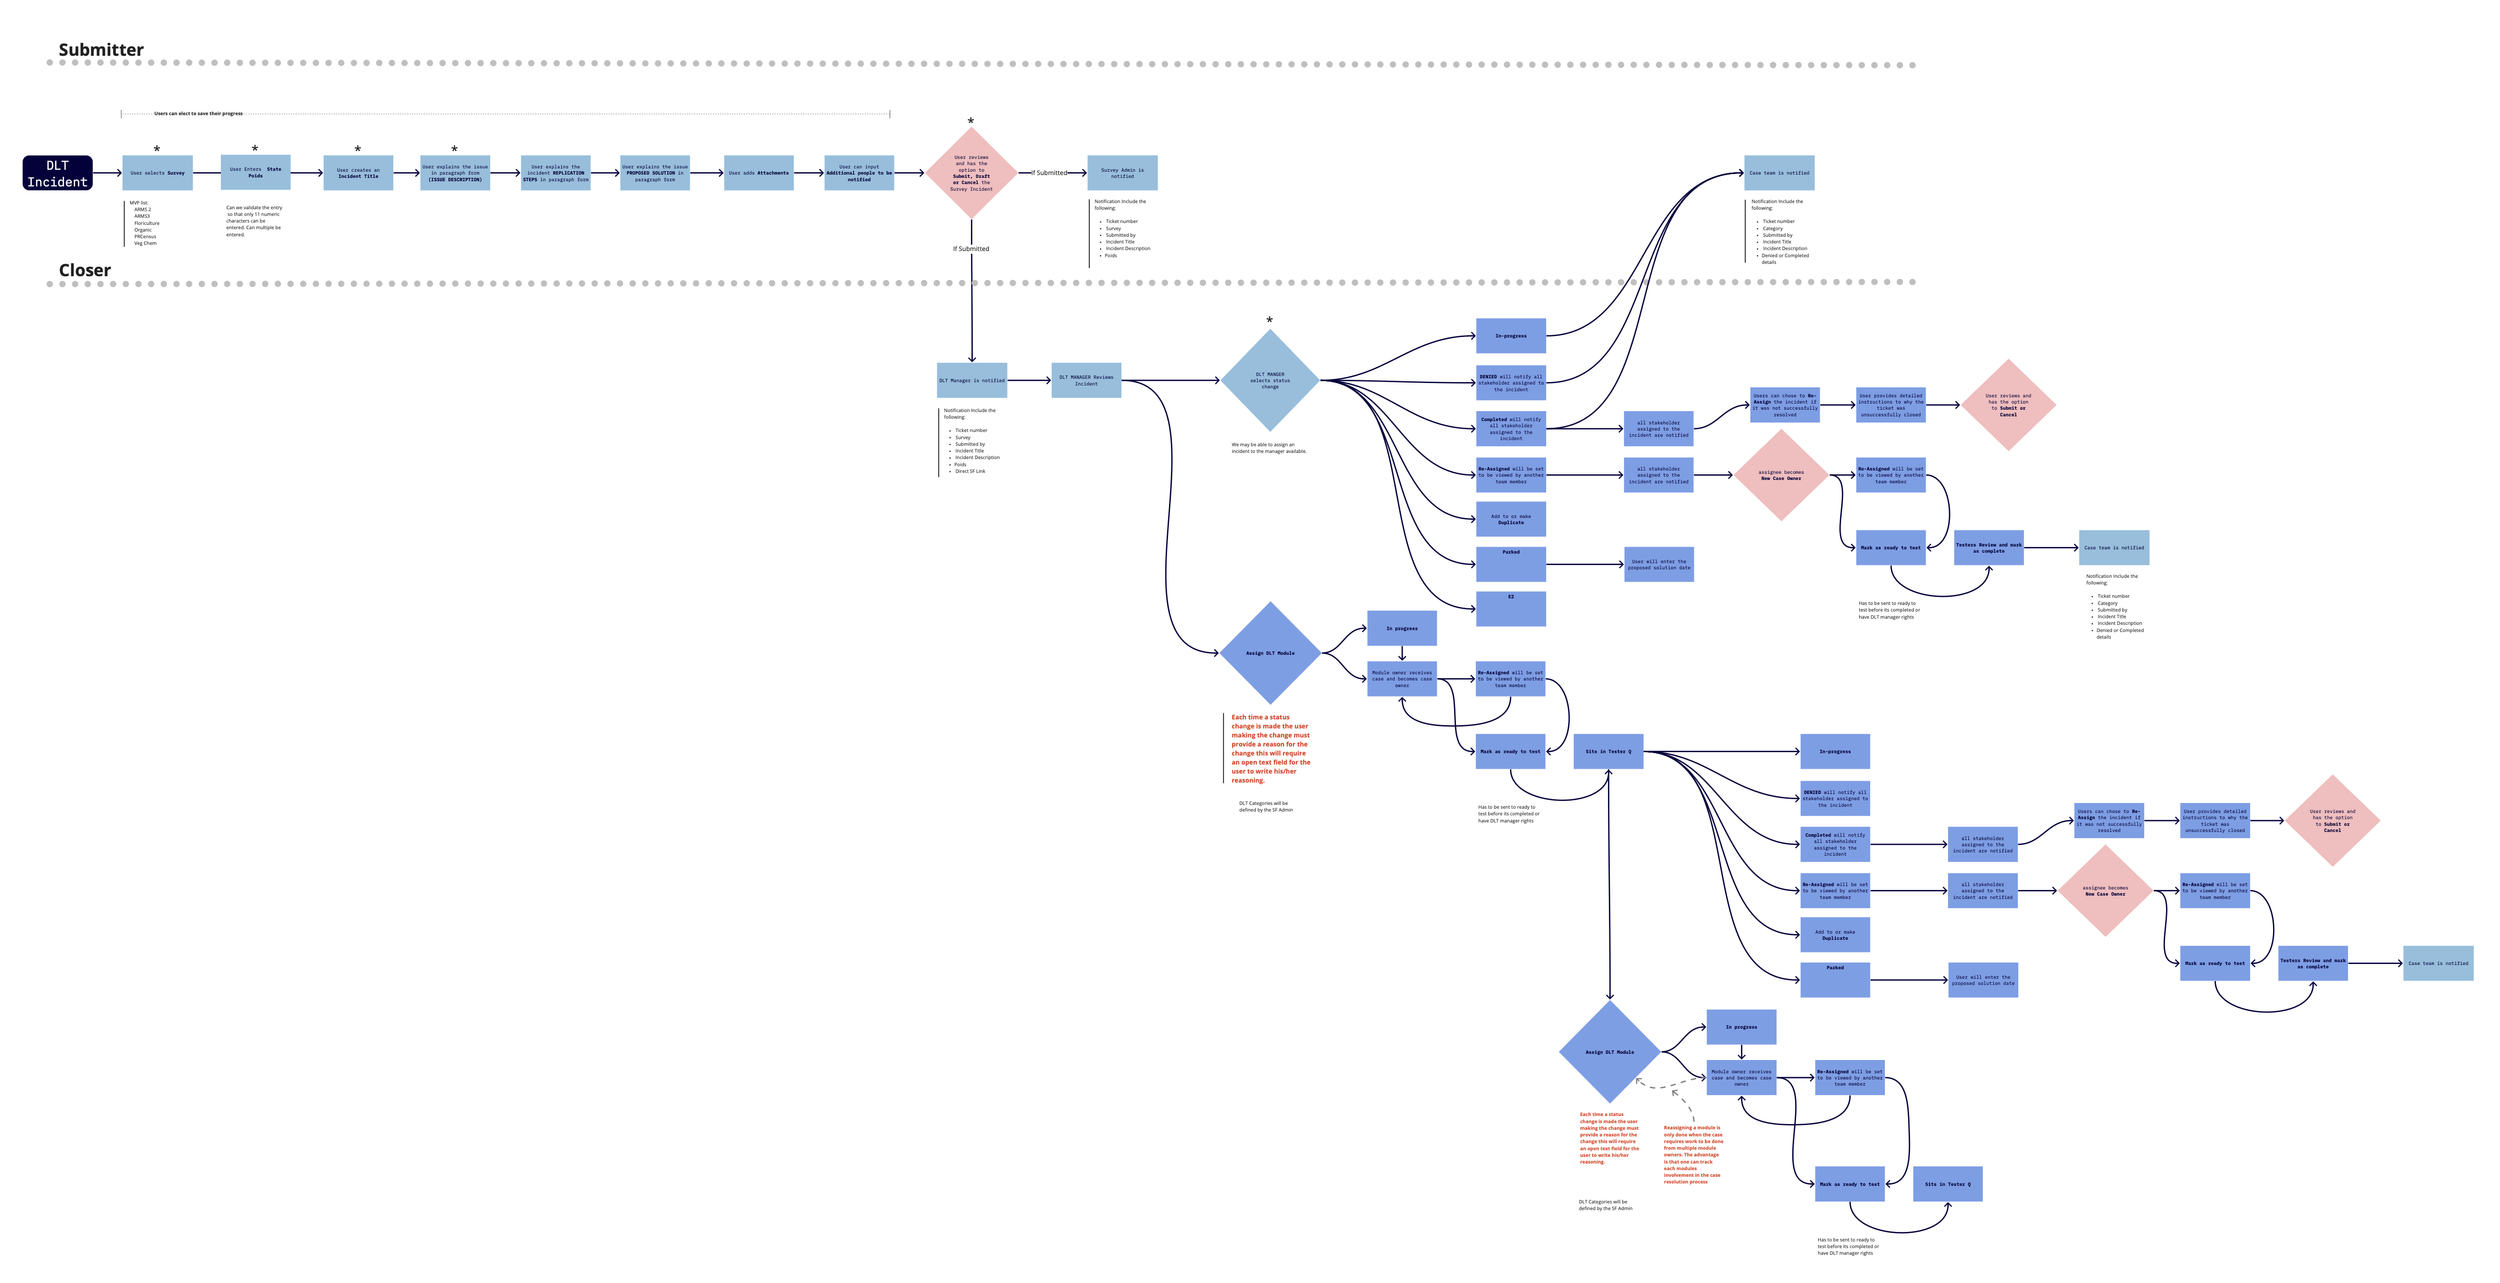
"One of the future state solutions was an Incident Tracking System, designed to allow NASS to track any incidents arising from business operations." Workflow diagrams accompanied user stories to guide developers through logic and decision trees; low-to-high fidelity prototypes were deemed unnecessary for Salesforce-based development.
[Image: screenshot of implemented system — Salesforce-based development]
 [Images: three workflow diagrams — Incident Tracking System process flows, decision trees, logic pathways]
9. Training Materials
"Once the developers completed their work, I captured screenshots of the newly developed software and created training materials to assist with the validation process." Resources supported specification verification and user testing handoff.
[Image: customer explanation diagram — system functionality / user interactions]
Conclusion
The comprehensive research, codification, diagramming, strategizing, and implementation documentation transformed NASS operations — providing "actionable insights, workflow diagrams, and training materials" while establishing a framework for future improvements.